
- Frequently Asked Questions

- All About Features
- How to Install the Tracking Code
- User Guides
- Integrating With Other Platforms
- Legal, Data Privacy & Certificates
- White Label Analytics
- Glossary
- Affiliate Program
- Contact
UTM Campaigns Feature
All About Your UTM Campaigns in 5 Sections
What It's All About

In the overview of the UTM Campaigns feature, we present you with a quick look at all the most important data from your campaigns. There will soon be a version in which you will be able to drag and drop the tiles in order to arrange them just as you wish.
Important Note: URL Campaigns or UTM parameters are NOT set up WITHIN the application itself. They are just automatically recognized by the app everytime a visitor uses a UTM Link that you have set up and embedded elsewhere.
View your UTM campaign data organized by the custom filters you set (e.g., "utm_source", "utm_medium", "utm_term"). This lets you focus on the insights that matter most to you.
The UTM Campaigns feature is divided into 5 sections:
Set the Time

Right above the tiles, you can see a date picker. This enables you to select a certain time period or specific day to which you want the dashboard's data to correspond.
It is crucial to limit the presentation of data to specific dates or timeframes during which you executed potential campaigns or implemented other strategies. This will allow you to assess the effectiveness of these actions and use the insights gained for future planning.
Some General Hints
- For some tiles, you may have the option "View More"(specific wording will depend on the tile you are viewing). For the example shown in the image above, it is "View Traffic Map". Selecting this button redirects you to a specific module with greater detail breakdown. Why not give it a try?
- Almost all tiles contain additional information if you hover over them. Just let your cursor run over various elements and discover how much data is actually packed into a tile. The tooltip will also show a description of the tile and links to both the Glossary and Support Center, which will give you more information.
- A campaign visitor is only counted as such if he has visited your website via a URL containing the UTM parameters that you set.
- If you see a label "Not Provided" somewhere in these views, this means that you have not added this UTM parameter to the corresponding UTM campaign being presented.
Overview

Note Upfront: Make sure not to overlook the general hints about the overview tiles and how to construct UTM campaigns!
The Overview section provides a concise summary of all crucial KPIs for your UTM campaigns. It is organized into the following report blocks:
- Campaigns' Visitors
- Top Performing UTM Campaigns
- Top UTM Term Parameter
- Top UTM Source Parameter
- Top UTM Mediums Parameter
- Top UTM Content Parameter
- Last 6 UTM Campaign Visitors
- Visitors via UTM campaigns by Country
These report blocks offer valuable insights into your campaign performance, helping you make informed decisions and optimize your strategies.
Campaigns' Visitors
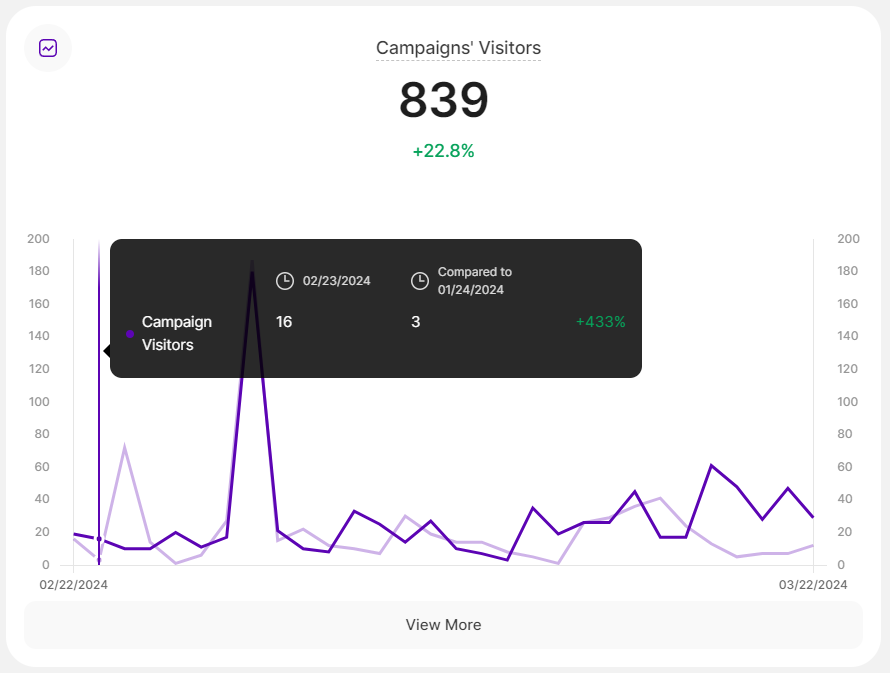
On this report block, you will see a quick overview of the total number of your campaigns' visitors (hint:not the unique visitors) based on the selected time range.
On the horizontal x-axis, you will always have the dates shown. Notice that the scale changes every time you update the time period in the selector above the report block.
The vertical y-axis shows the number of visitors. The scale is adapted automatically based on your website's performance.
Important Hints:
- This report block is totally dependent on the selected date range.
- The chart displays two lines: the dark purple line that represents the number of visitors for the selected time frame, and another line with a lighter shade that shows the data for the preceding period.
- Simply hover your mouse over any point on the graph to reveal more information. You'll see a comparison of the selected date's data with the corresponding data from the previous period. The comparison will also be defined as – colored in green or red – percentages, depending on the increase or decrease of data.
- To view all the UTM campaign visitors, simply click on the View More button located at the bottom of the report block. This will take you to the All UTM Campaign Visitors tab, which will show a more detailed view of your UTM campaigns visitors.
Top Performing UTM Campaigns

This report block displays a table view of your top performing campaigns’ "campaign parameter" (utm_campaign) that were recognized by the application – based on the amount of visitors with the listed UTM parameters.
You can use our simple UTM campaign builder tool to create a URL with UTM parameters. So once a visitor visits one of your websites' pages via a link containing a UTM parameter, the app will automatically notice this and generate statistics.
This helps you to understand which campaigns with a certain "utm_campaign" parameter worked best and attracted most of visitors to your website or which campaigns did not work well and need improvement.
Each line represents one registered UTM campaign name. Alongside each campaign name, you'll see:
- Total Visitors: The number of visitors that were "forwarded" by the campaigns containing that parameter.
- Percentage: This number shows what portion of your website traffic came from that specific campaign.
- Donut Chart: This visual aid provides a clear picture of how much traffic that campaign contributes compared to all your other campaigns.
Important Hints:
- The sum of all the percentages shown in this report block does not have to be 100% because there might be other "utm_source" that were used within your campaigns but are not included in this list.
- To view all the UTM campaigns, simply click on the View More button located at the bottom of the tile. This will take you to the My UTM Campaigns tab, which will show a more detailed view of your UTM campaigns.
Top UTM Term Parameter

This report block displays a table view of your top performing campaigns based on the campaigns' "term parameter" (utm_term) that were recognized by the application – based on the amount of visitors with the listed UTM parameters.
This helps you to understand which campaigns with a certain "utm_term" parameter are bringing in the most website visitors. This also helps you focus on your high performers and improve campaigns that need a boost.
Every line represents one name you have given to the parameter "utm_term" of your campaigns. Alongside, you will see the following information:
- Total Visitors: The number of visitors that were "forwarded" by the campaigns containing that parameter.
- Percentage: This number shows what portion of your website traffic came from those campaigns containing that parameter.
- Donut Chart: This visual aid provides a clear picture of how much traffic is forwarded by campaigns containing a certain "utm_term" compared to other campaigns.
Important Hints:
- The sum of all the percentages shown in this tile does not have to be 100% because there might be other "utm_term" that were used within your campaigns but are not included in this top list.
- To view all the UTM campaigns, simply click on the View More button located at the bottom of the report block. This will take you to the My UTM Campaigns tab, which will show a more detailed view of your UTM campaigns.
- You can use our simple UTM campaign builder tool to create a URL with UTM parameters. So once a visitor visits one of your website's pages via a link containing a UTM parameter, the app will automatically notice this and generate statistics.
Top UTM Source Parameter

This report block features both a donut chart and a bar chart, showcasing the top performing campaigns based on the campaigns' "source parameter" (utm_source) that were recognized by the application – based on the amount of visitors with the listed UTM parameters.
For clarity, labels are hidden from the chart. Hover your mouse over each section to view the following information:
- UTM source
- The number of visitors accessing your page via a link with this “utm_source” parameter
- The percentage indicating how much of your overall website's traffic was received by this source within the selected time period
The same data corresponds to the bar chart that you will see right below the donut chart. This module gives you a good overview of which campaigns need to be improved with certain "utm_source" parameters and which ones bring the most visitors to your website.
Important Hints:
- The sum of all the percentages shown in this report block does not have to be 100% because there might be other "utm_source" that were used within your campaigns but are not included in this list.
- To view all the UTM campaigns, simply click on the View More button located at the bottom of the tile. This will take you to the My UTM Campaigns tab, which will show a more detailed view of your UTM campaigns.
Top UTM Mediums Parameter

This report block features both a donut chart and a bar chart, showcasing the top performing campaigns based on the campaigns' "medium parameter" (utm_medium) that were recognized by the application – based on the amount of visitors with the listed UTM parameters.
For clarity, labels are hidden from the chart. Hover your mouse over each section to view the following information:
- UTM medium
- The number of visitors accessing your page via a link with this “utm_medium” parameter
- The percentage indicating how much of your overall website's traffic was received by this medium within the selected time period
The same data corresponds to the bar chart that you will see right below the donut chart. This module gives you a good overview of which campaigns need to be improved with certain "utm_medium" parameters and which ones will bring the most visitors to your website.
Important Hints:
- The sum of all the percentages shown in this report block does not have to be 100% because there might be other "utm_media" that were used within your campaigns but are not included in this list.
- To view all the UTM campaigns, simply click on the View More button located at the bottom of the tile. This will take you to the My UTM Campaigns tab, which will show a more detailed view of your UTM campaigns.
Top UTM Content Parameter

This report block features both a donut chart and a bar chart, featuring the top performing campaigns based on the campaigns' "content parameter" (utm_content) that were recognized by the application – based on the amount of visitors with the listed UTM parameters.
For clarity, labels are hidden from the chart. Hover your mouse over each section to view the following information:
- UTM content
- The number of visitors accessing your page via a link with this “utm_content” parameter
- The percentage indicating how much of your overall website's traffic was received by this content within the selected time period
The same data corresponds to the bar chart that you will see right below the donut chart. This module gives you a good overview of which campaigns need to be improved with certain "utm_content" parameters and which ones will bring the most visitors to your website.
Important Hints:
- The sum of all the percentages shown in this tile does not have to be 100% because there might be other "utm_content" that were used within your campaigns but are not included in this list.
- To view all the UTM campaigns, simply click on the View More button located at the bottom of the tile. This will take you to the My UTM Campaigns tab, which will show a more detailed view.
- This can be used for A/B testing, for example, or for content related ads to distinguish campaigns that refer to the same URL.
Last 6 UTM Campaign Visitors

On this report block, you will find a list of your six latest campaign visitors. Each row represents a visit and contains the following information:
- Visitor Location: The country flags represent the geographical origin of your website visitors.
- Visitor Type:
- New visitor: This visitor has not visited your website before.
- Returning visitor: This visitor has visited your website before.
- Converting visitor: This visitor has visited a page you defined as conversion page during his visit. Could be both a new or returning visitor.
- Device information: Shows the device used, Operating System and browser.
- Campaign Name: The “utm_campaign” component, found within the campaign data, is displayed below the visitor type. It serves as a key element for tracking or categorizing visitors based on their respective campaigns.
- Source: The “utm_source” component, integral to the campaign that initiated the visit, is positioned above the visit timestamp and to the right of the device information.
- Time: See the exact date and time each visitor arrived, or the time elapsed since their last visit.
Important Hint: To access additional details about your most recent campaign visitors, just tap the View More button located at the bottom of the report block. This will lead you to the All UTM Campaign Visitors tab, which will provide you with more in-depth information and insights.
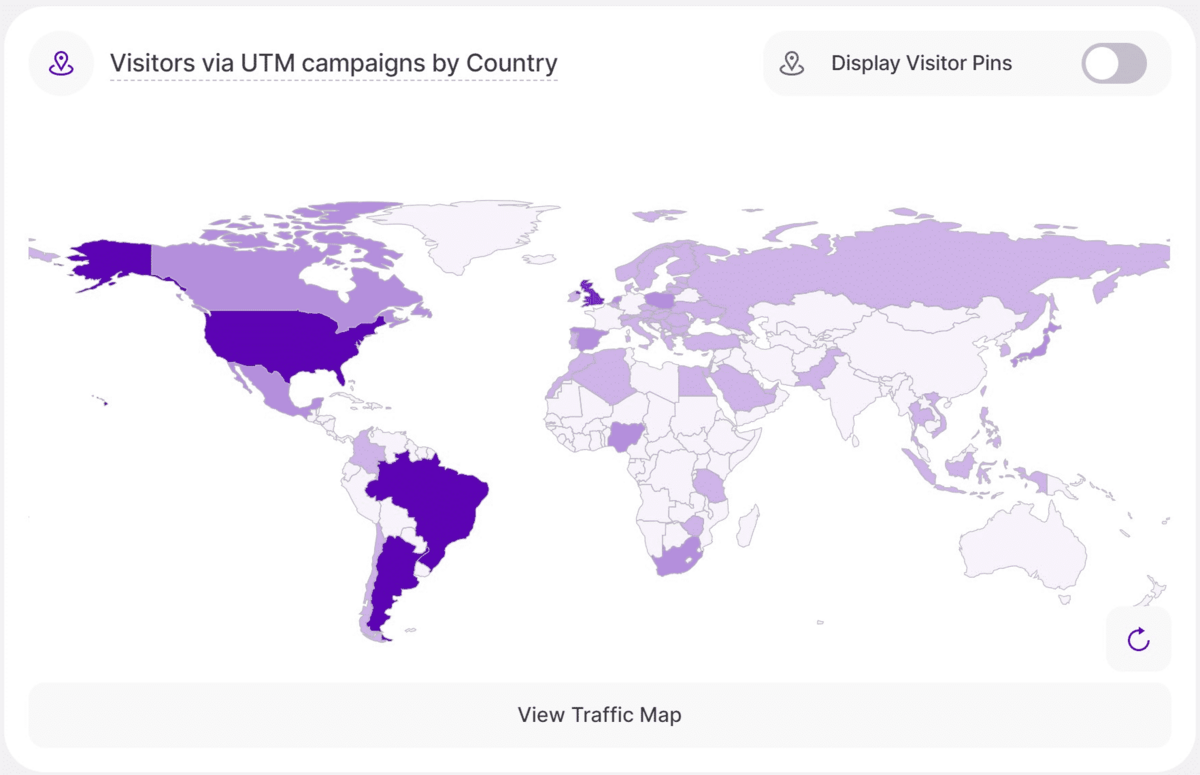
Visitors via UTM campaigns by Country

This map will give you an overview of the distribution of your website campaigns' visitors on a global level.
Countries are color-coded to reflect the intensity of campaign visitors, with darker shades of purple indicating a higher number of visitors from that country.
Hovering your cursor over a country reveals its flag, name, and the total number of campaign visits recorded within your selected time frame.
You can easily zoom in by scrolling your mouse wheel upwards or zoom out by scrolling downwards.
To refresh the map, simply click the Reload Map icon located at the lower right of this report block.
Important Hints:
- The View Traffic Map button at the lower part of the tile, will lead you to the Latest Visitors Map that displays your visitors' origins (city based even).
- You can enable or disable the Display Visitor Pins switch. Enable it to view the country flag pins or turn it off to have a simpler view of the map.
All UTM Campaign Visitors

This report block provides you with a list of all the latest UTM campaigns' visitors of your website within the selected date range. Each row of the table presents a campaigns' visit and displays a detailed information about each visitor.
The table is made up of the following columns:
- Campaign Name: The “utm_campaign” parameter, which you defined, is contained within the campaign that brought this visitor to your website.
- Source: The “utm_source” parameter, which you defined, is contained within the campaign that brought this visitor to your website.
- Medium: The "utm_medium" parameter, which you defined, is contained within the campaign that brought this visitor to your website.
- Term: The "utm_term" parameter, which you defined, is contained within the campaign that brought this visitor to your website.
- Visitor Location: Shows both the flag and the name of the country the campaigns' visitor is visiting from. Hover over the flag and it will show a little "location" icon, that once clicked, will forward you to the Visitors Map view where you will see more information about the approximate geo-location of that visitor.
- Visitor Type: This column provides information about whether this visitor is a
- New visitor: This visitor has not visited your website before.
- Returning visitor: This visitor has visited your website before.
- Converting visitor: This visitor has visited a page you defined as conversion page during his visit. Could be both a new or returning visitor.
- Visited Pages: Displays the number of pages the visitor has visited on your website during his session, sorted by the newest first. It shows the title of the page, URL, date, and time of visit. These are all influenced by the level of privacy data set.
- Time: Shows the date and time when the visitor started his session on your website.
- Session Recording: A video recording of the session, if applicable (represented by a video camera icon).
Important Hints:
- Want to focus on a specific period? Use the handy date picker in the top right corner to adjust the timeframe for this view.
- The table controls at the upper right let you set the number of visitors per page and navigate to other pages to explore more campaign visitor data.
My UTM Campaigns

On this tab, you will see the most important data of your automatically tracked UTM campaigns based on the “utm_campaign" parameter. This helps you to immediately identify how your UTM campaigns are performing.
This table breaks down the results of your marketing campaigns tagged with UTM parameters. Each row represents one registered UTM campaign name. Here's what you'll see for each campaign:
- UTM Campaign Name: The name you have defined for your campaign. Below it, you’ll see the date and time of the first visit through this campaign.
- Visitors: The total number of visitors your campaign brought to your website.
- Page Views: The total number of page views by visitors from this campaign.
- Top Date (Page Views): The date with the top amount of visits of the UTM campaign name in the selected period of time
- Campaign’s Top Visited Pages: The top three website's pages visited by visitors from this campaign in the selected timeframe.
- Campaign’s Top Visitor Countries: The top three countries where visitors originated from for this campaign during the selected period of time.
Important Hint: Each campaign is clickable! Click one to explore more data in the UTM Campaign Details View.
UTM Campaign Details View

This report block shows you a detailed view of your campaign's KPIs by parameter combinations. This will help you analyze which parameter combinations are currently effective and which ones aren't delivering as many visitors and optimize them for better results.
This table breaks down your UTM campaign data into several key categories:
- Source: Referrer (ex. google, customer_email, website)
- Medium: Marketing medium (ex. blog, paid_search, paid_social)
- Term: Search term or keyword used in paid ad or anchor text (ex. product value, best site analytics)
- Content: Content element where visit came from (ex. primary-button, showcase-video)
- Platform: Platform where the visit came from (ex. facebook, instagram, linkedin)
- Creative Format: Type of upversion from a specific design format (ex blackblue-version, blank-version)
- Marketing Tactic: The marketing tactic you used (ex. remarketing, prospecting)
- Visitors: Shows the total visitors and a line bar divided between New and Returning visitors.
- Sessions: The total number of sessions for this parameter combination
- Page Views: The total page views tracked for this parameter combination
- Average Session Duration: The average length of all visits' session duration(in minutes or seconds)
- Average Bounce Rate: The average bounce rate for this parameter combination. The bounce rate means the percentage of visitors that left your website after only one-page view.
Campaign Charts

This report block features both donut charts and bar charts showcasing three different campaign charts. On the left, you will see the donut chart that displays the total number of visitors based on the defined parameters within a selected time period.
On the right side, you’ll find a bar chart that breaks down the data into either daily or monthly based on the chosen time period. It also presents the following information: percentage indicating how much of your overall website's traffic was received by this UTM parameter and the number of visitors.
For clarity, labels are hidden from the donut chart. Hover your mouse over each segment to view more detailed information such as the defined parameters and the number of visitors.
Important Notes:
- The bars within the charts have different colors, that refer to the elements listed on the very right side of each chart.
- The displayed charts depend on your selected time range in the top right bar.
- Hovering over each bar chart will simultaneously show the corresponding percentage and day/month on the donut chart.
- If you want to check additional data in regards to theyour campaigns with UTM parameters, this is the correct view to open.
Campaign Charts - "Last 7 Days"
")
In the world of digital marketing and website analytics, understanding the sources of your website traffic and the effectiveness of your marketing campaigns is crucial for making informed decisions and optimizing your online presence. We'll explore three essential metrics that shed light on your website's traffic and campaign performance over a specified time frame.
On this tab, you'll find three different charts that were generated based on different UTM parameters and right above, you’ll find the option to select the time range that you want the data to correspond to. The options are: Last 7 days, Last 12 months and Last years. Note that the charts are always dependent on the selected time range.
Let’s take a closer look at the charts generated for the “Last 7 days” time period:
- Organic traffic vs traffic from UTM Campaigns by weekdays: This shows you the comparison of how many of your visitors were generated by organic traffic and how many were generated by your recognized UTM Campaigns. It helps you to see whether your UTM campaigns had an impact on the traffic of your website and on which of the past 7 days the campaigns were of highest effect.
- Number of Visitors per UTM_Source by weekdays: Here you see will see how your campaigns' traffic is split up by the sources where your campaigns' visitors actually came from. This does not have anything to do with your organic traffic. It just lists you the sources of your campaigns' traffic over the past 7 days. With this information you can improve the effectiveness of your UTM campaigns.
- Number of Visitors per UTM_Campaign (Name) by weekdays: This chart shows you the number of visitors to your website based on your UTM campaigns’ names(utm_name). This gives you an insight which of your UTM campaigns bring about the most benefit to your website's traffic based on the past 7 days. Analyze the well working UTM campaigns and why they are so successful. Then adapt the learnings to your UTM campaigns, which are not performing as well.
Campaign Charts - "Last 12 Months"
")
The second chart will provide you the following information about your UTM Campaigns for the past 12 months:
- Organic traffic vs traffic from UTM Campaigns by month: This shows you how many of your visitors (based on the selected timeframe) were generated by organic traffic and how many came from your recognized UTM campaigns. It helps you to see whether your UTM campaigns had an impact on the website traffic and during which months the campaigns were of the highest effect.
- The number of Visitors per UTM_Source by month: This chart focuses on visitors who arrived at your website through your UTM campaigns only within the selected timeframe. It breaks down these visitors by source, so you can see which websites or platforms (like social media or email) sent the most visitors to your site through your campaigns. Try different platforms or adjust campaigns on specific sources to see what works best. This data helps you make your marketing campaigns even more effective!
- Number of Visitors per UTM_Campaign (Name) by month: This chart reveals which of your marketing campaigns (identified by the utm_campaign parameter) generated the most website traffic over the past 12 months (based on the selected timeframe). Analyze the well-working UTM campaigns and why they are so successful. Then adapt the learnings to your UTM campaigns that need to be optimized.
Campaign Charts - "Last year(s)"
")
You may also select a specific year to view from the furthest box on the right as shown here. You may select any year going back to 2018.
Let’s take a closer look at the charts generated for the “Last year(s)” time period:
- Organic traffic vs traffic from UTM Campaigns by month: This shows you the comparison of how many of your visitors were generated by organic traffic and how many came from your recognized UTM Campaigns. It helps you to see whether your UTM campaigns had an impact on the traffic of your website and on which month(s) of the selected year the campaigns were of highest effect.
- Number of Visitors per UTM_Source by month: This chart focuses on visitors who arrived at your website through your UTM campaigns only within the selected timeframe.It breaks down these visitors by source over the selected year so you can analyze which sources sent the most visitors to your site. With this information you can improve the effectiveness of your UTM campaigns.
- Number of Visitors per UTM_Campaign (Name) by month: This chart shows you the number of visitors to your website based on your UTM campaigns’ names(utm_name). This gives you an insight which of your UTM campaigns bring about the most benefit to your website's traffic based on the selected year. Analyze the well working UTM campaigns and why they are so successful. Then adapt the learnings to your UTM campaigns, which are not performing as well.
Important Hints:
- The data from the charts above can support you with many different topics, i.e. in planning your campaigns or timing updates/downtime of your website.
- Check these charts regularly to always be up to date when it comes to planning your marketing/technical measures. This will support you strongly in generating maximum success of your launched campaigns.
UTM URL Builder

The UTM URL Builder allows you to easily add campaign parameters to your URLs so you can measure your own custom campaigns within our app. Enter the website URL and the campaign information, then share the generated link with your audience.
Once a visitor visits one of your websites' pages via a link containing UTM parameters, our platform will automatically recognize them and generate categorized statistics.