Overview
All the Essential Website KPIs in One Place
Use the Overview to Assess Health and Performance
Key Visitor & Session Insights
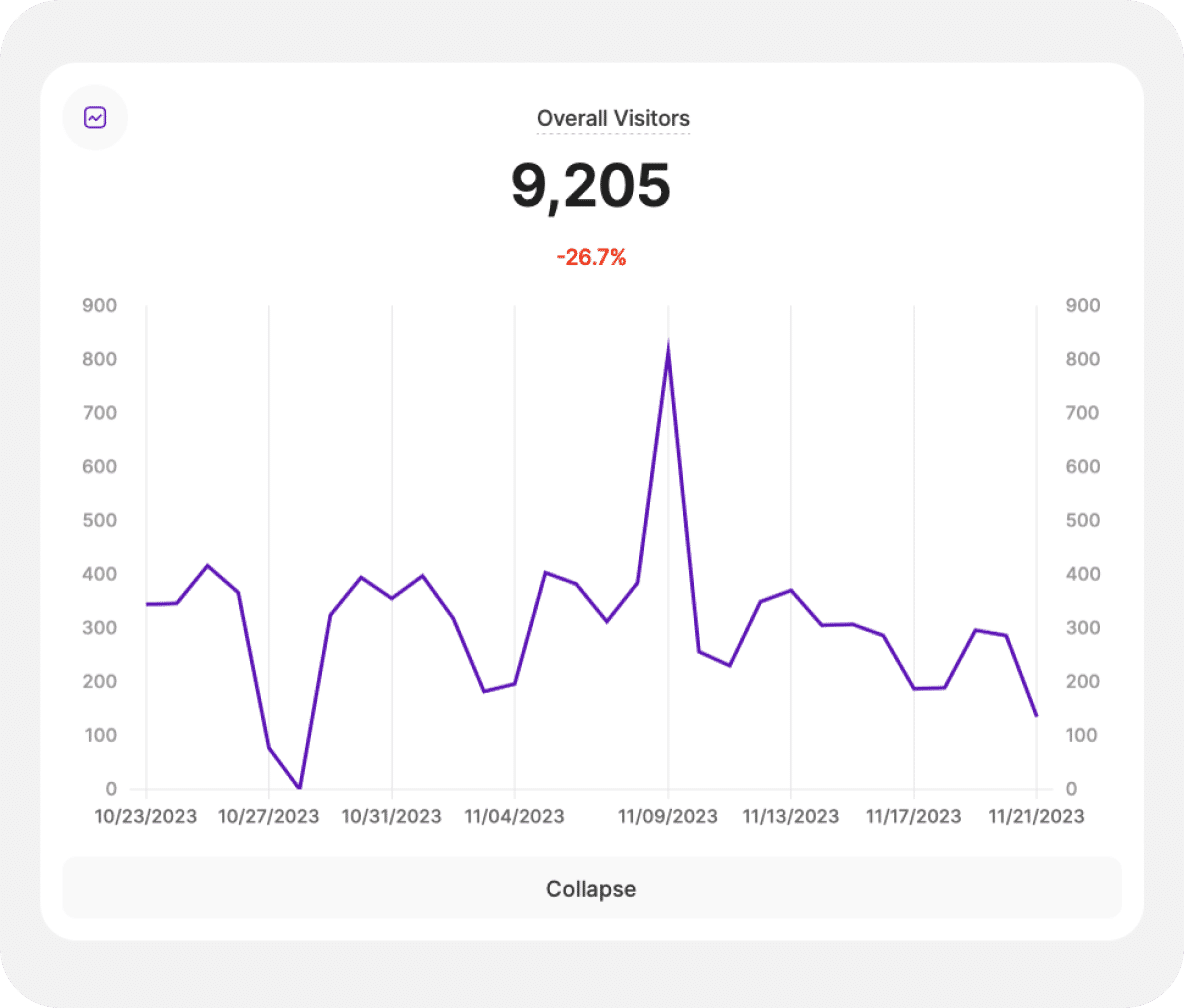
The Overview module provides a snapshot of all Key Peformance Indicators (KPIs) in real-time. See these top-level metrics in one place and understand site growth at-a-glance. View data by day, week, month, or year, or compare two different time periods.
With TWIPLA, it's easy to see the effectiveness of your website and how well it achieves end goals. View all the most important website traffic, visitor, and session engagement figures in one place, with the interactive graphs bringing data to life.
Why Use Overview Statistics?
- Absorb data quickly without deep-diving into reports.
- Identify sudden changes in traffic activity in real-time.
- Easily spot engagement trends across time periods.
- Make high-level decisions from actionable data.
Website Statistics Overview
Top-Level Traffic and Engagement Insights
Bird's-Eye Performance Insights
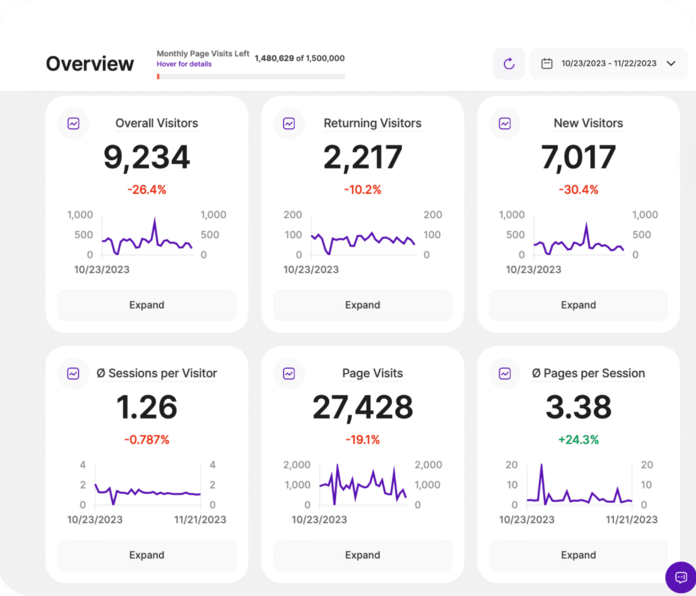
Click into the overview and see all the top-level performance metrics that matter. Overall visitors. Returning visitors. New visitors. Sessions per visitor. Page visits. Pages per session. Session duration. Bounce rate. They're all here, neatly displayed alongside each other.
Come here and immediately grasp visitor trends and engagement levels, with metrics also displayed in interactive graph form for ease of insight. Leverage this high-level perspective for informed strategic decision-making when you don't want to be distracted by the details.
It's all highly intuitive, just as you'd expect from TWIPLA. So use the overview to quickly gauge the general health of your website. Immediately see the impact of recent optimization activities, and understand your effectiveness at meeting key website end goals.
Go Deeper into Your Overview Metrics
Discover Our Complete Website Statistics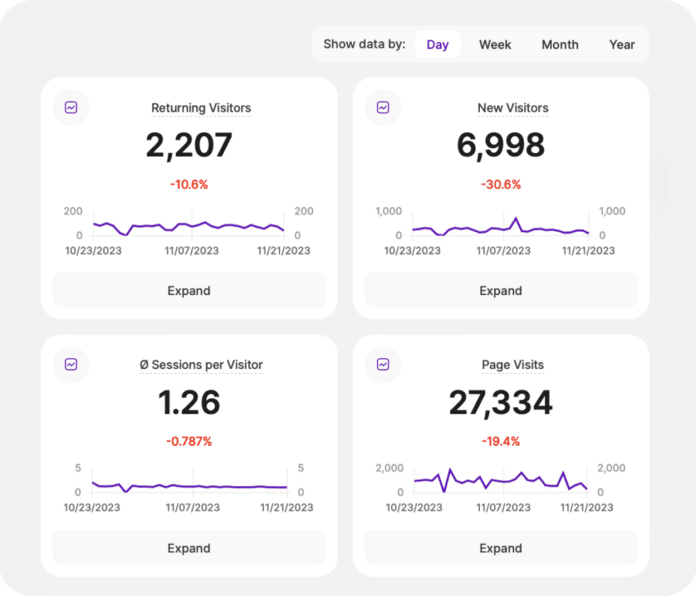
View Daily to Yearly Metrics
With TWIPLA, you can quickly change the date range of displayed data. Toggle between day, week, month, or year view with one click. Use this tool to focus in on whatever you're interested in today, from tracking short-term campaigns to long-term business growth.
View daily metrics to identify abrupt changes in website traffic numbers or visitor behavior. And since TWIPLA doesn't use batching, see developments as they happen in real-time. So stay agile to website performance and make quick changes for fast results.
Alternatively, view data in weekly, monthly, or yearly mode to get a broader understanding of visitor trends and patterns. Use this wider perspective for effective long-term strategic planning, and to understand seasonal variations or year-on-year business growth.
Confirm Overview Trends With Users
Discover Visitor Communication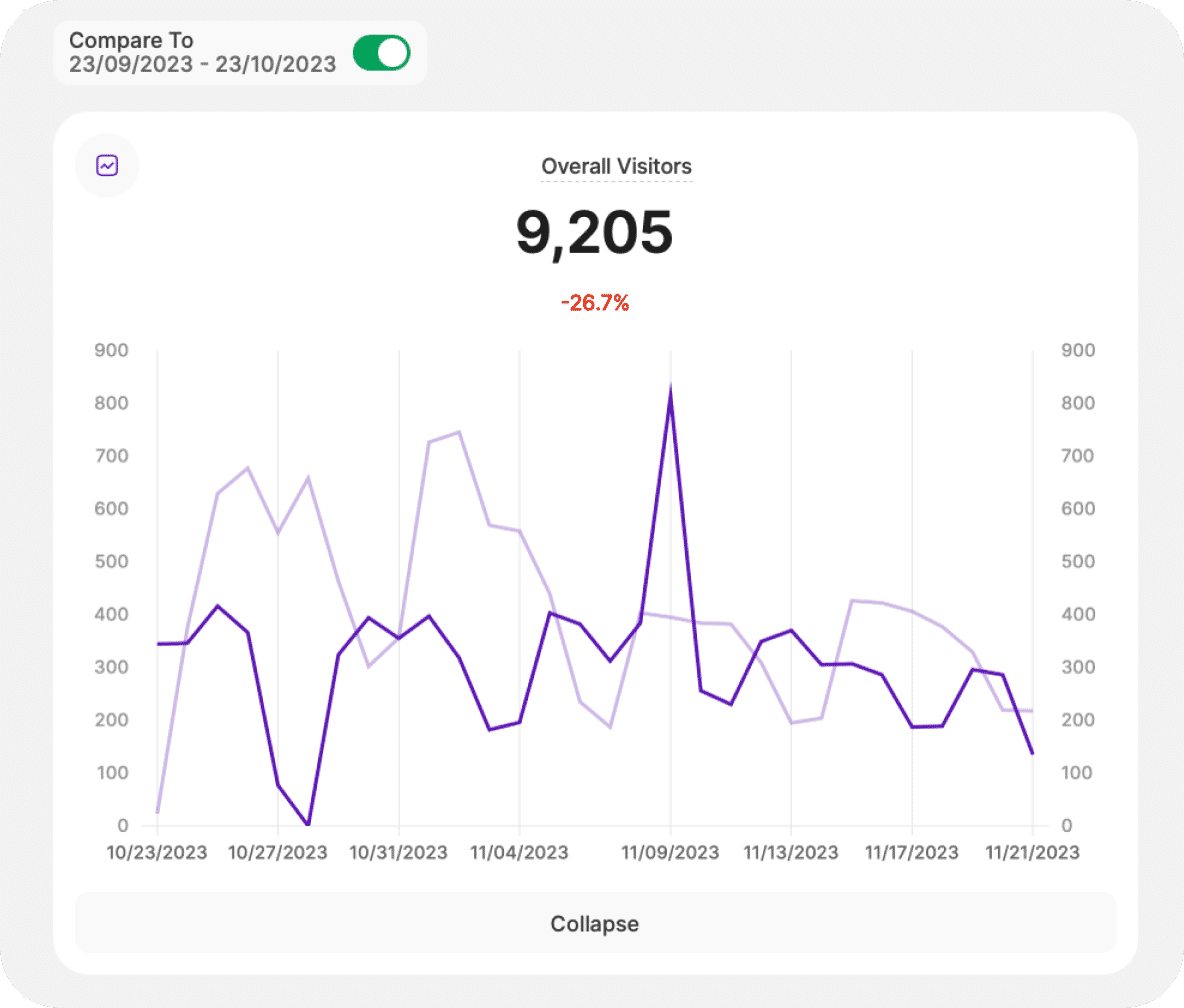
Compare Two Time Intervals
Next, quickly compare the top-level metrics between two time periods of your choice. Get deeper insight into your website's performance dynamic and assess the impact of specific digital marketing campaigns or any website optimization activities.
So use this feature and compare data around a campaign period to assess its effectiveness. Build a nuanced understanding of how different strategies or external factors are influencing your metrics and turn these data-driven insights into effective digital decisions.
Also use it for historic benchmarking. Assess current performance with past data. See how today compares with yesterday, last month, or last year. Leverage the overview to measure progress, identify successful strategies, and plan improvements with greater precision.