Simon Coulthard January 31, 2024

eCommerce metrics really are a constellation of North Stars for online retail businesses, guiding webstore development like nothing else can.
Regardless of whether you’re a new seller with little experience or a seasoned store owner with plenty of notches on your checkout basket, these numbers let you know where you’re winning, and where you need to improve.
Simply put, data matters. Online business is more competitive than ever, but the right KPIs for eCommerce sites will get you a slice of the pie. And take it from fact guru Statista, this growing market has rich pickings for those that know how to thrive in this data-driven world.
The hard part is knowing which metrics to focus on, and the best eCommerce platform to pull them from.
But we’re an advanced website intelligence solution with complete eCommerce Statistics that’s quietly powering the success of over 2.5 million businesses. So we’ve been busy surveying our community to find out which performance metrics matter most to them.
We were surprised by just how many of them responded, with thousands sending in their thoughts on everything from eCommerce operations to B2B KPIs. But the general vibe was this: a select list of metrics are highly valued by eCommerce businesses, having quickly taken them from basket cases to shopping cart whisperers.
So let’s checkout these top eCommerce performance KPIs, categorized by department. Click on one of the links below to jump down to the category that interests you most, or scroll through for the full tour.
- eCommerce KPIs for Sales and Revenue.
- eCommerce KPIs for Customer Acquisition and Retention.
- eCommerce KPIs for Website Performance.
- eCommerce KPIs for Shopping Cart and Checkout.
- eCommerce KPIs for Marketing.
- eCommerce KPIs for Inventory and Fulfillment.

Ka-Ching! eCommerce Metrics
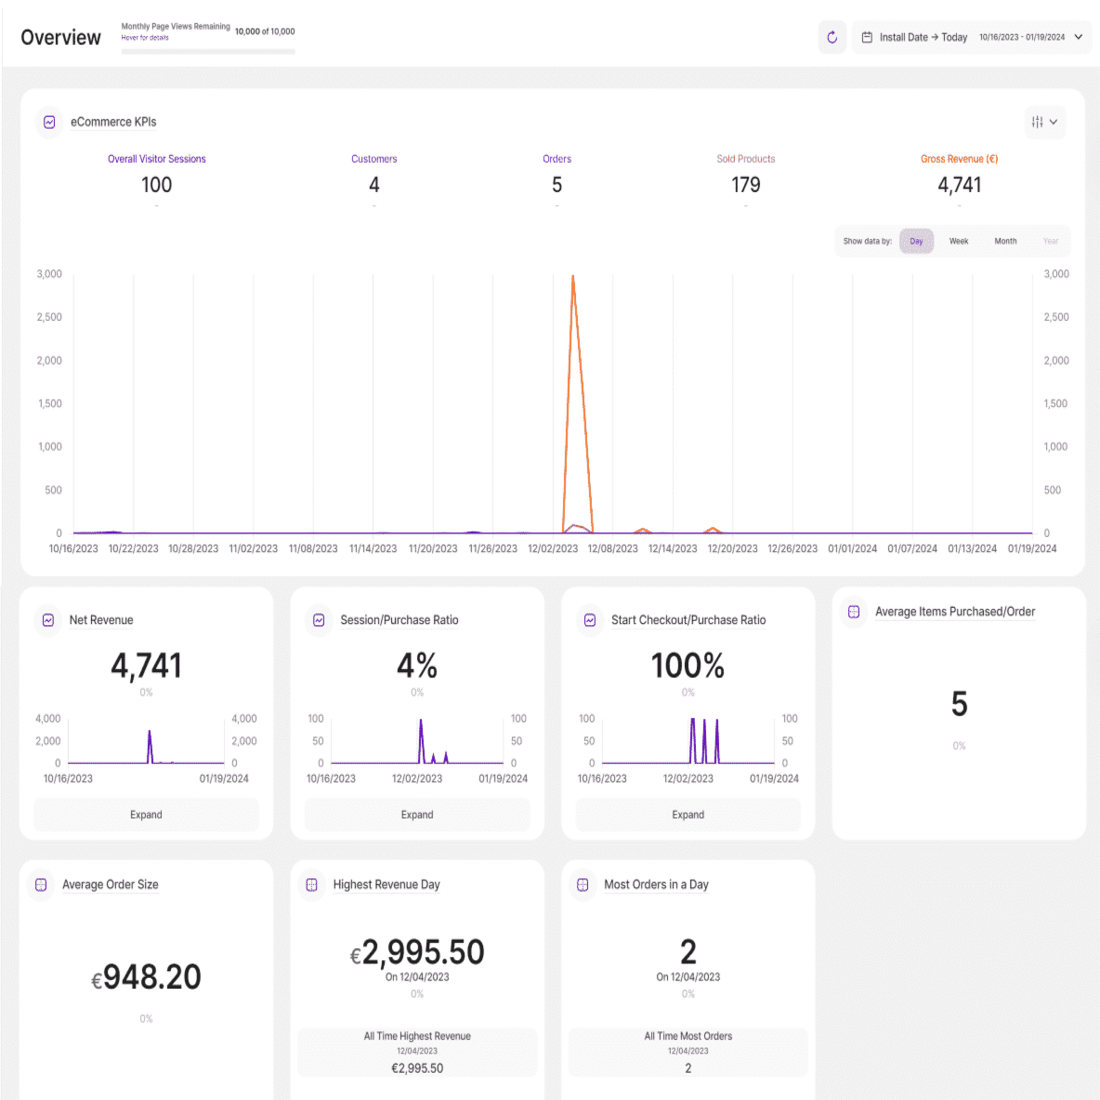
Join TWIPLA and never pay a cent. Get an eCommerce KPI dashboard alongside complete website statistics, behavior analytics tools, and visitor communication features. Have everything you need to effectively guide webstore growth.
eCommerce KPIs for Sales and Revenue.
Conversion Rate.
What is Conversion Rate? This is the ratio of visitors who make a purchase from your store.
Conversion Rate Formula: [Total Number of Conversions / Total Number of Visitors] x 100.
Average Order Value (AOV).
What is Average Order Value? This is the average spend by customers per order.
Average Order Value Formula: Total (Gross) Revenue / Total Number of Orders.
Total Revenue.
What is Total Revenue? This is the total income generated from sales.
Total Revenue Formula: Sum (All Individual Order Amounts).
Gross Profit Margin.
What is Gross Profit Margin? This is the percentage of revenue remaining after subtracting the Cost of Goods Sold (COGS), which is the direct cost of producing or purchasing the items. COGS includes expenses such as raw materials, labor, manufacturing costs, and any other costs directly associated with producing the goods sold by a business.
Gross Profit Margin Formula: [(Total Revenue - Cost of Goods Sold) / Total Revenue] x 100.
Net Profit Margin.
What is Net Profit Margin? It's the percentage of revenue left after subtracting expenses.
Net Profit Margin Formula: [(Total Revenue - Total Expenses) / Total Revenue] x 100.
Revenue by Traffic Source.
What is Revenue by Traffic Source? This is the amount of income generated from sales categorized by the source traffic channel. This is essential for understanding the performance of different traffic sources.
Revenue by Traffic Source Formula: Sum (Revenue from Each Traffic Source).
Total Visitor Sessions.
What is Total Visitor Sessions? This is the total number of unique sessions or visits to a webstore or website.
Total Visitor Sessions Formula: Sum (All Unique Visitor Sessions).
Gross Revenue.
What is Gross Revenue? This is the total income generated from sales.
Gross Revenue Formula: Sum (Revenue from All Individual Orders).
NET Revenue.
What is NET Revenue? This is income left after subtracting all discounts, returns, and refunds. The metric provides a clearer picture of the actual revenue received.
NET Revenue Formula: Gross Revenue - (Returns + Discounts + Refunds).
Session to Purchase Ratio.
What is Session to Purchase Ratio? This is the percentage of visitor sessions that result in a purchase. It provides crucial insights into the conversion rate of visitors into customers.
Session to Purchase Ratio Formula: (Number of Sessions with a Purchase / Total Sessions).
Start Checkout to Purchase Ratio.
What is Start Checkout to Purchase Ratio? This is the percentage of store visitors that start and complete the checkout process, buying their products from the webstore.
Start Checkout to Product Ratio Formula: (Number of Checkouts Completed / Number of Checkouts Initiated).
Average Number of Items per Order.
What is Average Number of Items per Order? This is the average number of products purchased by customers in a single order, and provides insight into buying behavior.
Average Number of Items per Order Formula: Number of Items Sold / Total Order Count.
Highest Revenue Day.
What is Highest Revenue Day? This is the day with the most income generated from sales.
How to Find Your Highest Revenue Day: Check your accounts to identify the day that brought in the most money from orders.
Highest Sales Day.
What is Highest Sales Day? This is the day with the highest NET revenue, which accounts for any discounts, returns, refunds, and other deductions.
How to Calculate Your Highest Sales Day: Check your accounts to identify the data that brought in the most NET revenue.
Most-Sold Products.
What is Most-Sold Products? These are your items that have the highest total sales volume.
How to identify your Most-Sold Products: Use your inventory to identify which items you sell most often.
Most-Viewed Products.
What is Most-Viewed Products? These are your products or product pages that experience the highest number of webstore views.
How to Identify Your Most-Viewed Products: Use analytics to view your product pages ranked by views.
Kill the Calculator
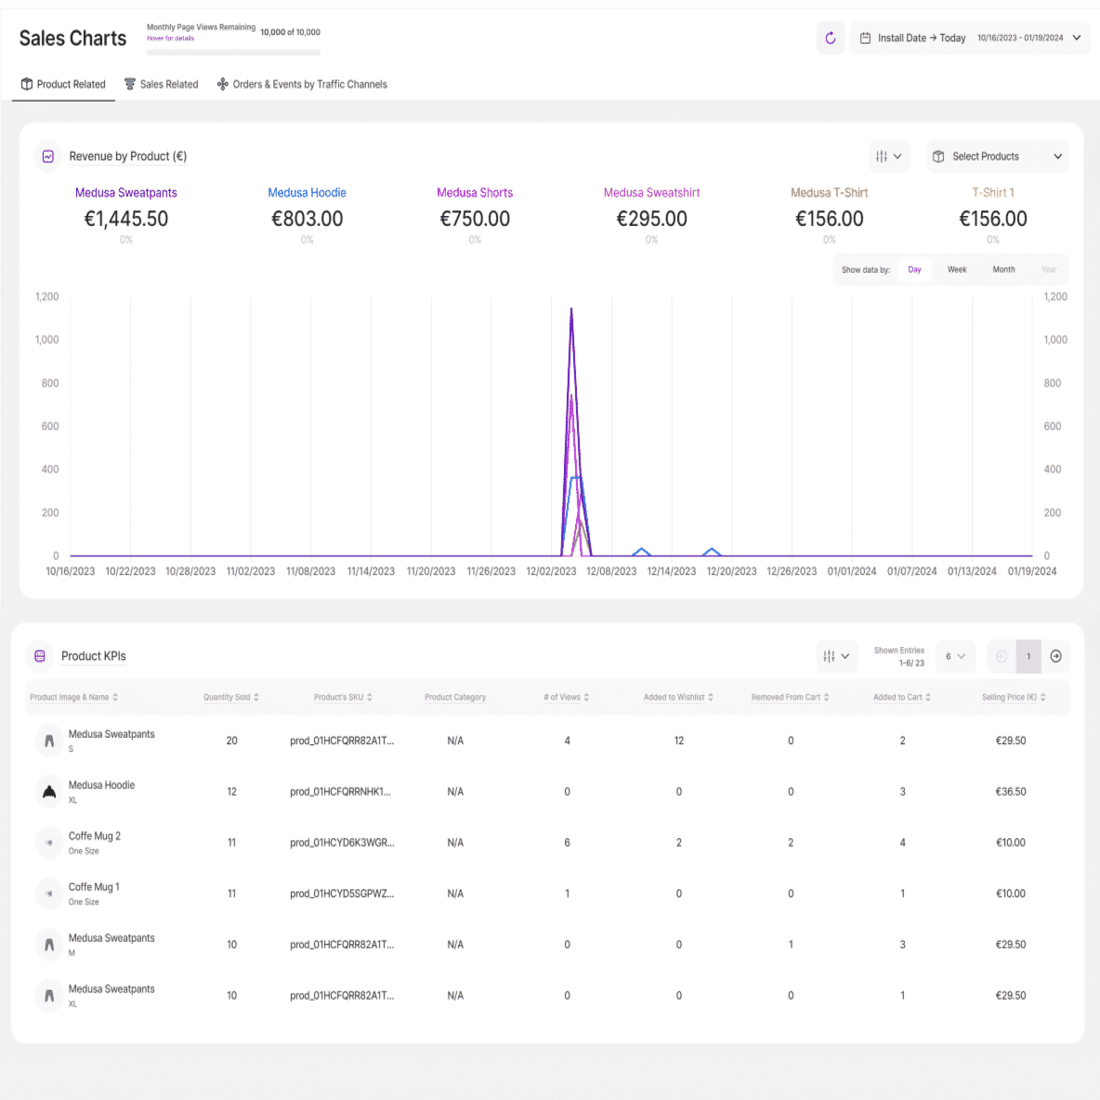
Start monitoring your KPIs without the math. Our platform provides performance insights in real-time. Get analytics on customers, products, sales, and channels. Arm yourself with the data you need to maximize sales and revenue.
eCommerce KPIs for Customer Acquisition and Retention.
Customer Acquisition Cost (CAC).
What is Customer Acquisition Cost? This is the cost to your business of getting a new paying customer. This can include a range of expenses related to marketing and sales activities, such as advertising, promotional costs, and salaries.
Customer Acquisition Cost Formula: Total Marketing and Sales Expenses / Number of New Customers Acquired.
Customer Lifetime Value (CLV or LTV).
What is Customer Lifetime Value? This is the total revenue expected from a customer over the course of their entire relationship with your business, and takes into account the potential income from all their future purchases.
Customer Lifetime Value Formula: Average Purchase Value x Average Purchase Frequency x Average Customer Lifespan.
Customer Retention Rate.
What is Customer Retention Rate? This is the percentage of customers who remain active and continue to make purchases from a business over a fixed period. It’s crucial for measuring customer loyalty and business stability.
Customer Retention Rate Formula: [(Number of Customers at End of Period - Number of New Customers Acquired) / Number of Customers at Start of Period] x 100.
Repeat Purchase Rate.
What is Repeat Purchase Rate? This is the percentage of customers who complete multiple orders from a business. It indicates the level of customer loyalty and the ability of a business to encourage repeat buying.
Repeat Purchase Rate Formula: (Number of Customers with More than One Purchase / Total Number of Customers) x 100.
Churn Rate.
What is Churn Rate? This is the percentage of customers that stop buying from a business.
Churn Rate Formula: (Number of Customers Lost / Total Number of Customers at the Beginning of the Period) x 100.
Percentage of Returning Customers.
What is Percentage of Returning Customers? This is the proportion of customers who return to make an additional order or orders, and is essential for assessing customer loyalty and the ability to encourage repeat business.
Percentage of Returning Customers Formula: (Number of Customers with More than One Purchase / Total Number of Customers) x 100.
Email Opt-Ins.
What is Email Opt-Ins? This is the total number of customers or prospects who have subscribed to receive emails from a business.
Email Opt-Ins Formula: Sum (Subscribers to Email lists).
Customer Count.
What is Customer Count? This is a business’s total number of unique customers.
Customer Count Formula: Sum (All Unique Paying Customers).
eCommerce KPIs for Website Performance.
Total Website Traffic.
What is Total Website Traffic? This is the total number of visitors to a webstore or website.
How to Calculate Website Traffic? Sum (All Website Visitors).
Website Traffic by Source.
What is Website Traffic by Source? This is the number of visitors to a webstore or website that arrive from different digital channels.
How to Calculate Website Traffic by Source? Sum (All Website Visitors from Online Source).
Learn How to Unlock Your Website's Traffic Potential
Bounce Rate.
What is Bounce Rate? This is the percentage of visitors to a webstore or website who leave after viewing only one page. It’s a key metric for assessing the engagement and user experience of a webstore or website.
Bounce Rate Formula: (Number of Single-Page Visits / Total Number of Visits) x 100.
Average Session Duration.
What is Average Session Duration? This is the average amount of time that webstore or website visitors browse during a session.
Average Session Duration Formula: Total Session Duration / Total Number of Sessions.
Page Load Time.
What is Page Load Time? This is the average time taken for a webpage to load all content and elements. It measures the speed and efficiency of the loading process, which can significantly impact the user experience and SEO rating.
Page Load Time Formula: Total Page Load Time / Number of Page Loads.
Learn How to Improve Your Page Load Speed
Total Visitor Sessions.
What is Total Visitor Sessions? This is the total number of unique sessions or visits to a webstore or website.
Total Visitor Sessions Formula: Sum (All Unique Visitor Sessions).

eCommerce KPIs for Shopping Cart and Checkout.
Cart Abandonment Rate.
What is Cart Abandonment Rate? This is the percentage of visitors who fill shopping carts with items but abandon them before completing the checkout process. It’s essential for assessing the effectiveness of the checkout process and potential revenue loss.
Cart Abandonment Rate Formula: (Abandoned Cart Count / Total Carts Created) x 100.
Checkout Abandonment Rate.
What is Checkout Abandonment Rate? This is the percentage of webstore or website visitors who start but don’t finish the checkout process. It enables you to understand the conversion efficiency of your checkout process.
Checkout Abandonment Rate Formula: (Number of Abandoned Checkouts / Number of Checkouts Initiated) x 100.
Checkout Conversion Rate.
What is Checkout Conversion Rate? This is the percentage of webstore or website visitors who start and then complete the checkout process.
Checkout Conversion Rate Formula: (Number of Completed Checkouts / Number of Checkouts Initiated) x 100.
Order Count.
What is Order Count? This is the total number of orders placed or completed by webstore or website visitors.
Order Count Formula: Sum (All Completed Orders).
Sold Product Count.
What is Sold Product Count? This is the total number of products sold by a webstore.
Sold Product Count Formula: Sum (All Individual Products Sold).
eCommerce KPIs for Marketing.
Return on Investment (ROI).
What is Return on Investment? In the context of eCommerce, this financial metric measures the profitability of an investment, campaign, or other activity by comparing the net profit gained to the cost of the investment.
Return on Investment Formula: [(Net Profit - Investment Cost) / Investment Cost] x 100.
Cost per Click (CPC).
What is Cost per Click? This is the cost to a business of every click on an advertisement or link. It is a key metric for assessing the efficiency of online advertising campaigns.
Cost per Click Formula: Total Cost of Clicks / Total Number of Clicks.
Click-Through Rate (CTR).
What is Click-Through Rate? This is the percentage of webstore or website visitors who click on a specific link. It’s an important metric for measuring the effectiveness of call-to-action elements or links.
Click-Through Rate Formula: (Number of Clicks on Link / Number of Impressions) x 100.
Social Media Engagement Rate.
What is Social Media Engagement Rate? This is the percentage of social media users who engage with shared content by liking, commenting, sharing, or clicking on the post.
Social Media Engagement Rate Formula: (Total Engagements / Total Impressions) x 100.

eCommerce KPIs for Inventory and Fulfillment.
Inventory Turnover.
What is Inventory Turnover? This is a measure of how quickly a business sells its inventory, and is an important metric for assessing inventory management efficiency.
Inventory Turnover Formula: Cost of Goods Sold (COGS) / Average Inventory Value.
Stockout Rate.
What is Stockout Rate? This is the percentage of time that products are out of stock, and is essential for assessing inventory management and potential revenue loss due to shortages.
Stockout Rate Formula: (Total Out-of-Stock Days / Total Days) x 100.
Order Fulfillment Time.
What is the Order Fulfillment Time? It's the average time taken to process and ship orders, and is vital for understanding the efficiency of order processing and customer satisfaction.
Order Fulfillment Time Formula: Total Order Processing Time / Total Number of Orders.
Privacy-Perfect eComm Insights
Our platform can be used legitimately under all laws without consent from customers. So go cookieless, collect more data, and get better insights. Remove your ugly consent banner and confusing compliance responsibilities. It's analytics made easy.
That’s Your Top eCommerce Metrics and KPIs!
There we go, that’s all the best KPIs for measuring the performance of an eCommerce business, as recommended by our community of online selling experts.
And if you want to start analyzing these metrics without having to pull out a calculator, then the best way to do so is to adopt a website intelligence platform like TWIPLA.
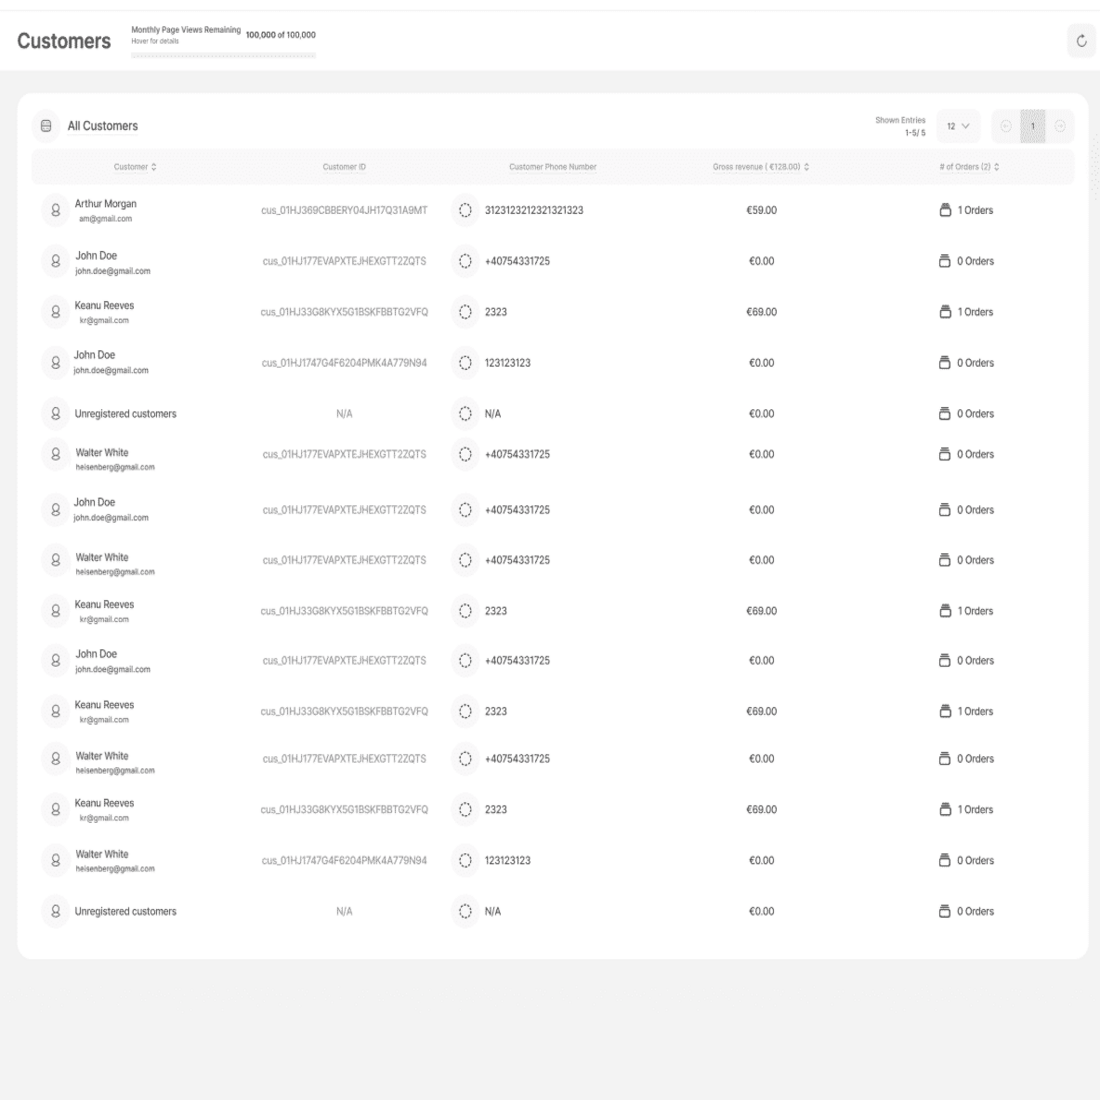
Our eCommerce Statistics toolkit has everything sellers need to drive sales, with performance metrics, a historic client database, and analytics on products, store processes, and traffic channels.
It’s also powered by our advanced cookieless tracking technology that keeps you privacy compliant, and customer data safe. So sign up for free today and get your store moving!
Share article
Get Started for Free
Gain World-Class Insights & Offer Innovative Privacy & Security


Stay Updated & Get Inbox Insights
Keep pace with the world of privacy-first analytics with a monthly round-up of news, advices and updates!


