Competition Analysis
Benchmark Website Performance Metrics
Use Competition Analysis to Gain a Strategic Advantage
Compare Data with Any Industry
Competition Analysis is a powerful website intelligence feature that enables businesses to benchmark key metrics against industry standards. Add context to website performance, align to industry market patterns, and identify potent new avenues to explore.
At TWIPLA, we've made it simple to get the comparative intelligence you need. Compare data with any sector or country you want. Activate time filters and analyze performance KPIs historically. View the data in graph form, and quickly identify actionable insights.
Why Use Competition Analysis?
- Copy competitor strategies and gain market share.
- Make data-driven decisions from comparative data.
- Find key optimization areas to better achieve goals.
- Identify industry trends and increase marketing agility.
Granular Competition Analysis
Use Industry Standards to Guide Website Growth
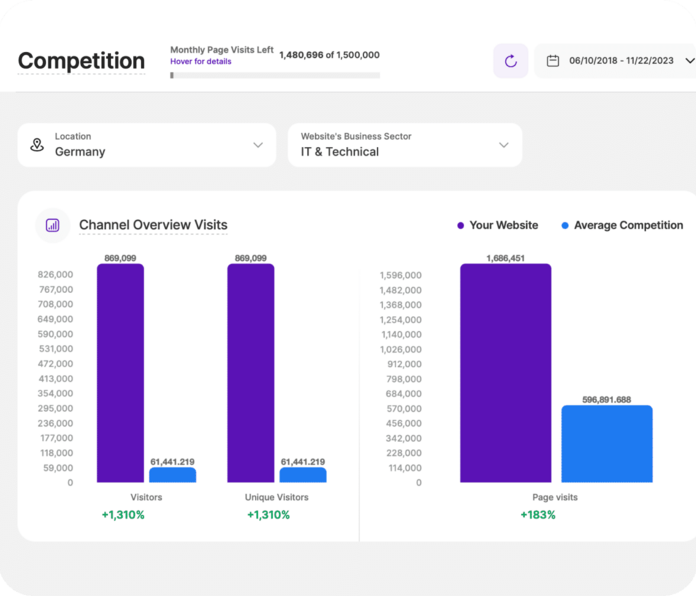
Benchmark Key Traffic Metrics
Visitors. Unique visitors. Page visits. Understand what these key performance metrics mean in context. Compare your own data with the international sector average with a single click, or jump to any country or industry that you're interested in benchmarking today.
View the insights in intuitive graph form, with a mouse hover also converting data to list form. Then, filter what you see to the date range of your choice, and use this to identify whether changes result from in-house work, or are reflective of broader market forces.
So use TWIPLA and get the data you need on your precise market position. Then, use these actionable insights for strategic decision-making. Identify key areas for growth and other lucrative new opportunities to take the lead in your country and industry.
Analyze Competition Researching Your Business
Discover Company Reveal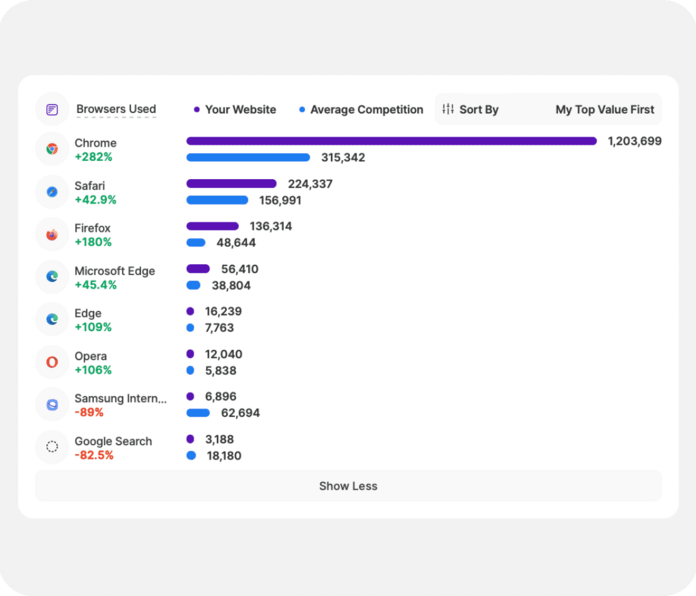
See Visitor Browser Standards
Next, use Competition Analysis to analyze global browser usage, or filter by sector and country to understand how your audience compares with others. Then, use these data-driven insights to optimize to wider patterns, enhancing UX and compatibility.
All the key data is displayed on an interactive rankings graph for ease of understanding, with all browser types included. Easily spot trends and adapt strategies accordingly. Overtake your competition by preparing your website for its target audience before they arrive!
Leverage TWIPLA and also anticipate future changes in browser preferences. So stay ahead of the curve by continuously adapting to the ever-changing technological landscape, ensuring your full digital presence remains accessible and appealing to your target audience.
Understand Digital Performance from Every Angle
Discover Complete Website Statistics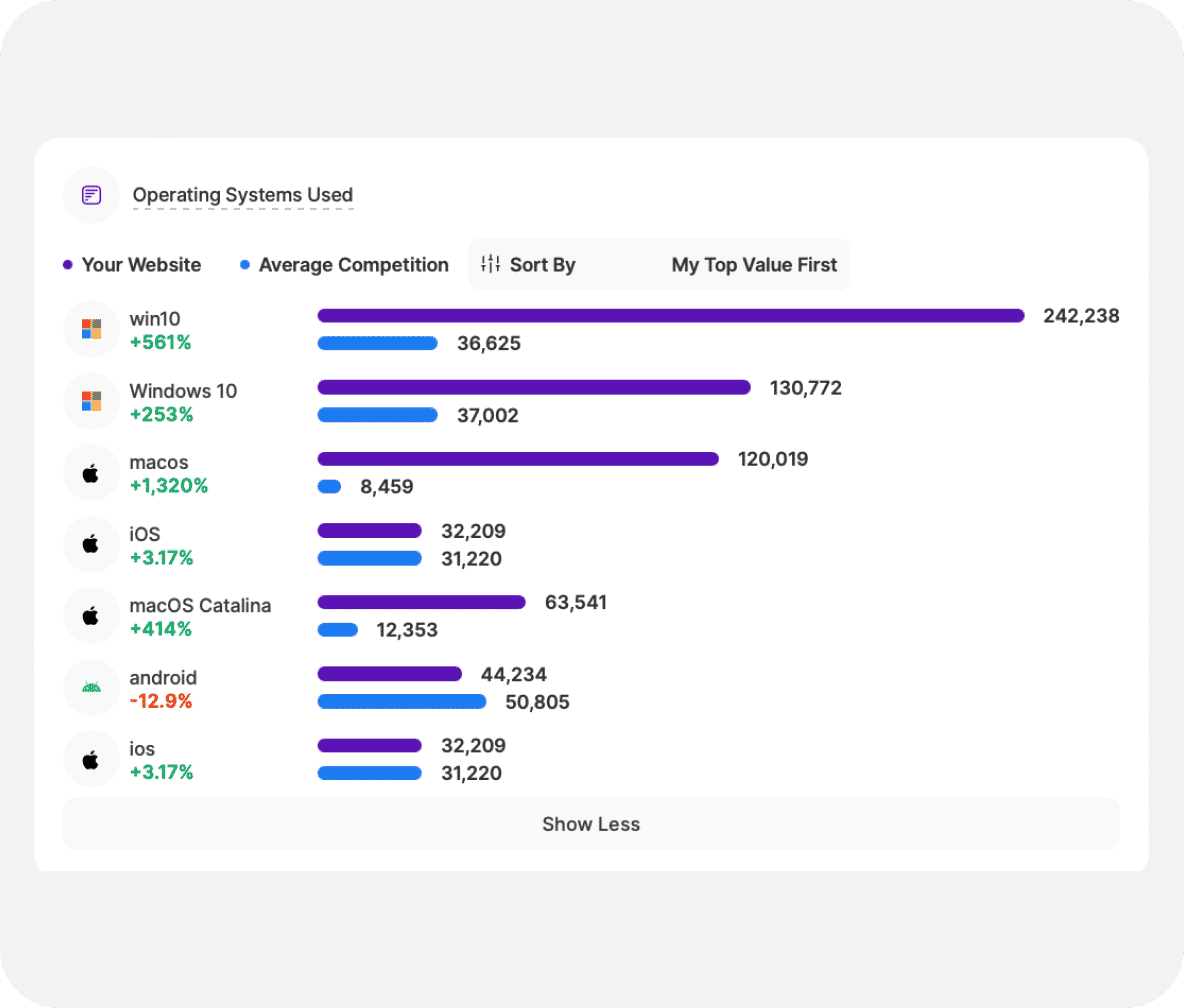
Compare Core Software Choices
View the popularity of different operating systems among your website visitors ranked in order, and also how this compares by sector and by country. Benchmark your audience against global trends, and use this data to dictate effective optimization priorities.
From Chrome to Linux, use the intuitive graph to visualize operating system preferences clearly. Filter what you see to the exact time frame you need. Then, quickly identify patterns in OS usage and align your technical website strategy accordingly for best results.
So use Competition Analysis and stay up-to-date on global system usage. Ensure your website's functionality and appeal across diverse audience types. Adapt to the changing technological landscape and maintain a competitive edge by catering to the most prevalent OS.
Go Deeper into Website Visitor Engagement
Discover Behavior Analytics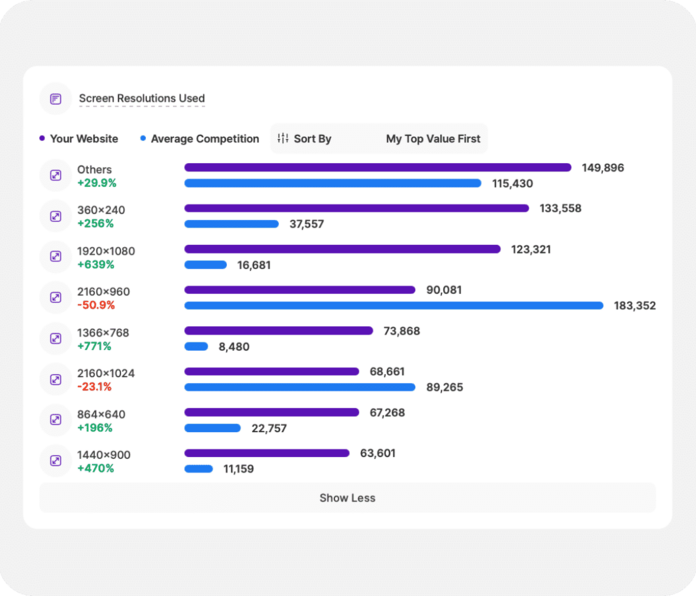
Benchmark Graphics Settings
Alternatively, see how the screen resolution preferences of your website visitors correlates with global norms across different sectors and regions. Then, optimize your website to current and future markets of interest, and give visitors a seamless UX from day one.
Know which graphics settings are growing in popularity, and which ones aren't worth focusing on for the moment. With TWIPLA, all the important data is displayed graphically for ease of insight, making it simple to integrate data into website layout and design decisions.
So keep up with changing screen resolution trends and future-proof the responsiveness and visual appeal of your website. Be proactive to changing visitor preferences. And enhance overall engagement by making your website attractive to as many people as possible.
2.5m Businesses Use Competition Analysis
Read Some Client Success Stories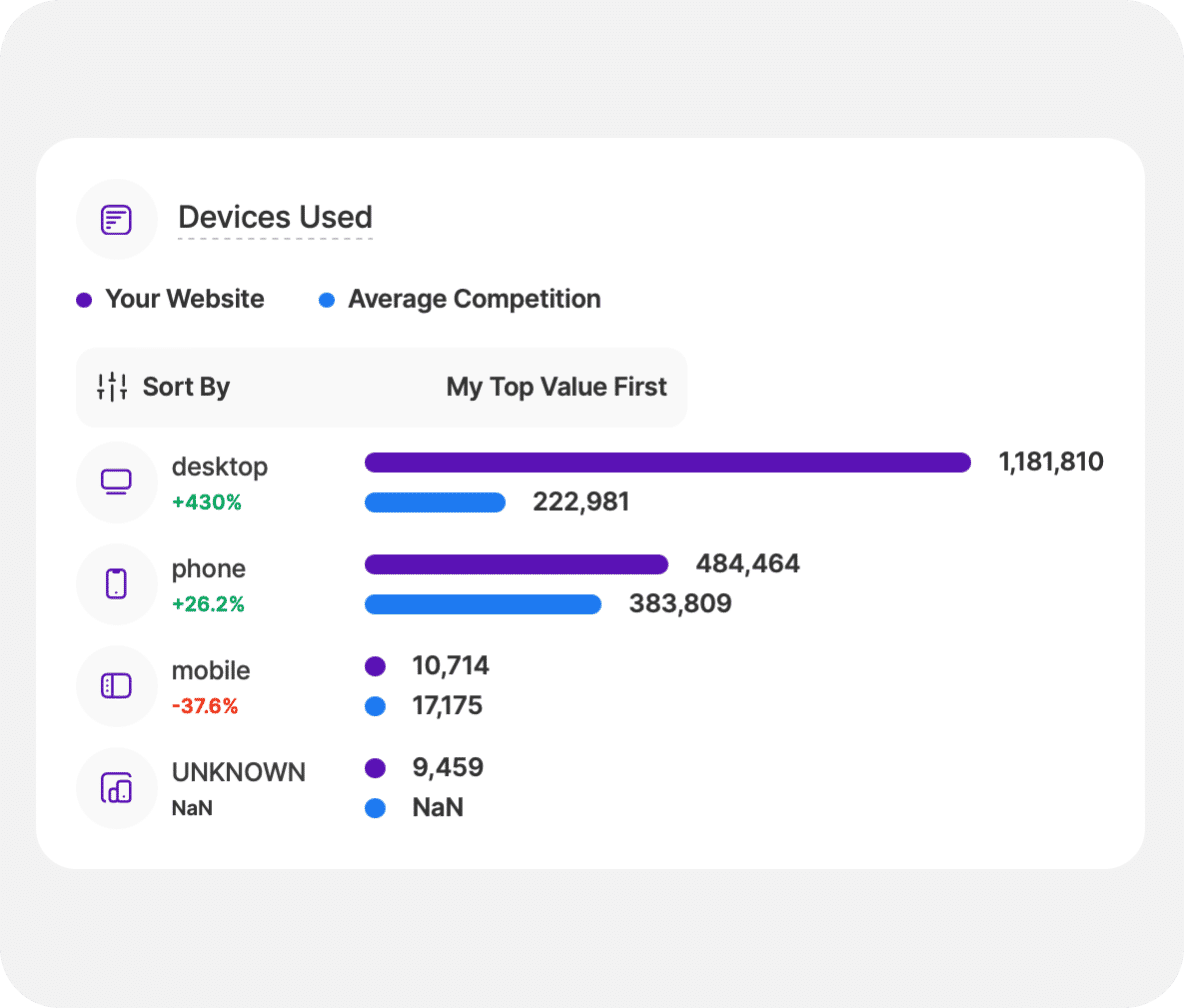
Compare Hardware Preferences
Finally, see how website visitor device usage preferences compare with other sectors and countries of operation that matter to you. Use real data to know whether to prioritize desktop, smartphone, or tablet optimization, and whether this is likely to change in the future.
All data is clearly displayed on an intuitive graphical interface, just as you'd expect from TWIPLA. So use Competition Analysis to make informed decisions about website optimization across devices, and ensure that the largest number of users enjoy the experience.
Leverage TWIPLA and stay abreast of evolving device preferences. Maintain both a competitive market advantage and relevant online presence. And ensure that you're catering to all the likely preferences of your diverse global audience - both today and long in the future.