Custom Dashboards
Consolidated Website Data Displays
Use the Dashboards to Effortlessly Navigate Analytics Insights
View Your Analytics Data Your Way
Three ++ Dynamic Dashboards
Flexible Visualization Options
Dashboards are specialized interfaces that streamline and present key website intelligence insights from across our analytics platform. This enables businesses to see the real-time, consolidated reports that are crucial for making informed decisions quickly and efficiently.
With TWIPLA, you can pull up Master and Pages dashboards that display synthesized insights from different perspectives. We also offer Custom Dashboards; create a board for any overarching goals or specific tasks, and control contributor access to sensitive data.
Enhancing the customization options, select from a wide range of data visualization types. This feature allows you to represent your data visually, making it even easier to interpret and share insights.
Why Use Dashboards?
- Visualize key website trends and insights at a glance.
- Stay up-to-date using real-time performance reports.
- Customize data reports to business requirements.
- Save time and effort with user-friendly interfaces.
Discover Our Advanced Dashboards
Three Intuitive Data Viewing Options
An Overview of TWIPLA Insights
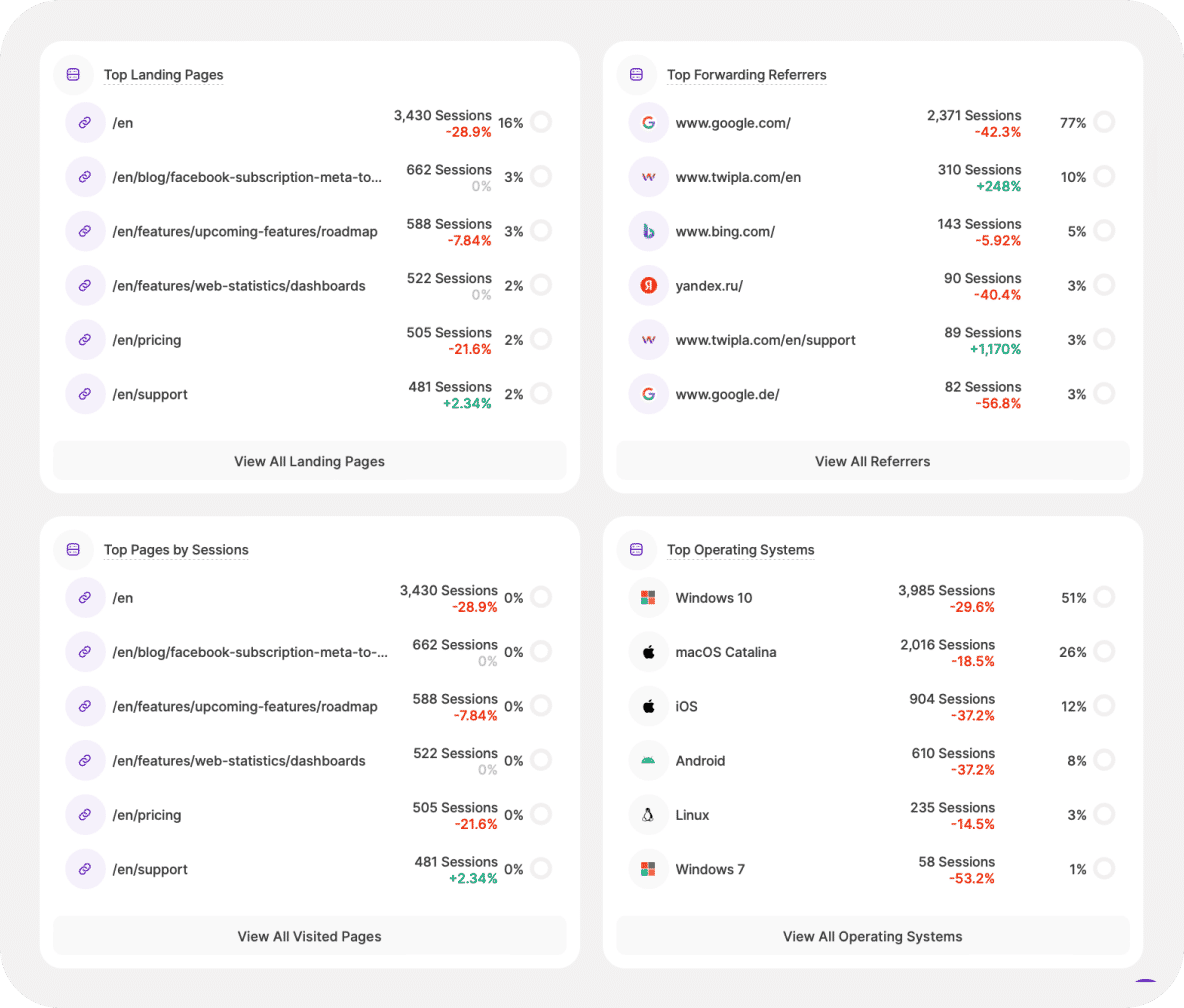
Website performance analytics shouldn't be a puzzle, and our Master Dashboard arranges all the main pieces for you. Dive in, and see a sweeping overview of website performance: from your traffic structure to visitor insights and device preferences, it's all here.
Scroll down and you'll find behavior analytics data. View key insights on heatmaps, conversion funnels, session recordings, and event tracking. Also check how surveys and polls are doing. See what's going on across your site without having to jump between modules.
Whether you're on a desktop at the office, a tablet in a meeting, or on your phone in the wild, essential insights about your website's trajectory are just a click away. So stay informed and agile about what's happening with a dashboard designed for the modern web.
Quickly Compare and Filter Data
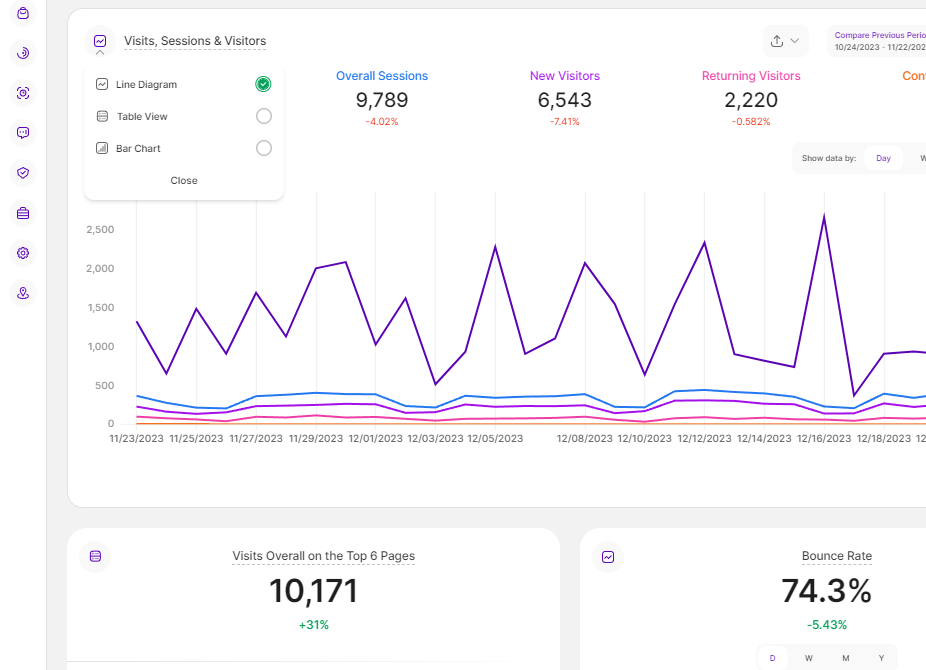
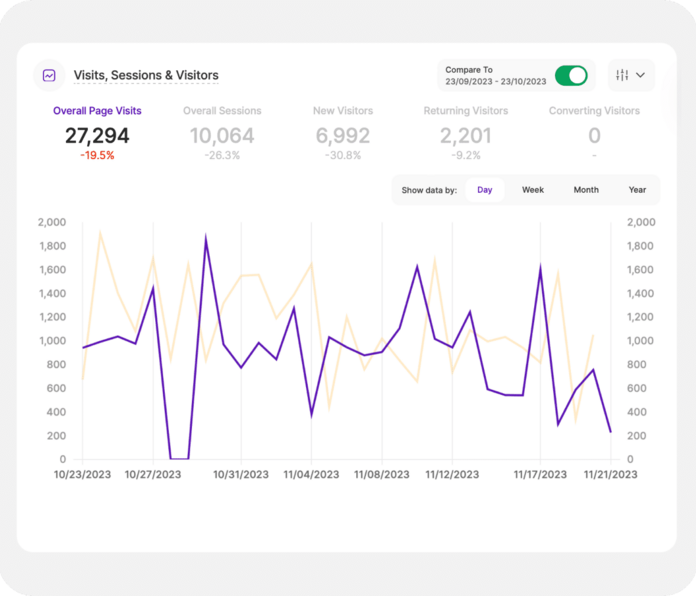
Jump into the Master Dashboard and you'll be welcomed by an interactive graph of key visits, sessions, and visitors metrics, with a mouse hover revealing data in table form. It's all also highly filterable, enabling you to focus quickly on the exact information you need.
Alternatively, choose your narrative. Select the time period you want to monitor and see how these key website statistics have changed over time. Toggle between daily, weekly, monthly, and yearly view, or compare the data between two time periods of your choice.
So use the Master Dashboard to remove unnecessary labor from analysis. Leverage all the key insights in one place, and quickly filter away irrelevant data. Know how your site is performing from every angle, and free up time to focus on the work that matters most.
Go Deeper into Dashboard Insights
Discover Our Complete Website Statistics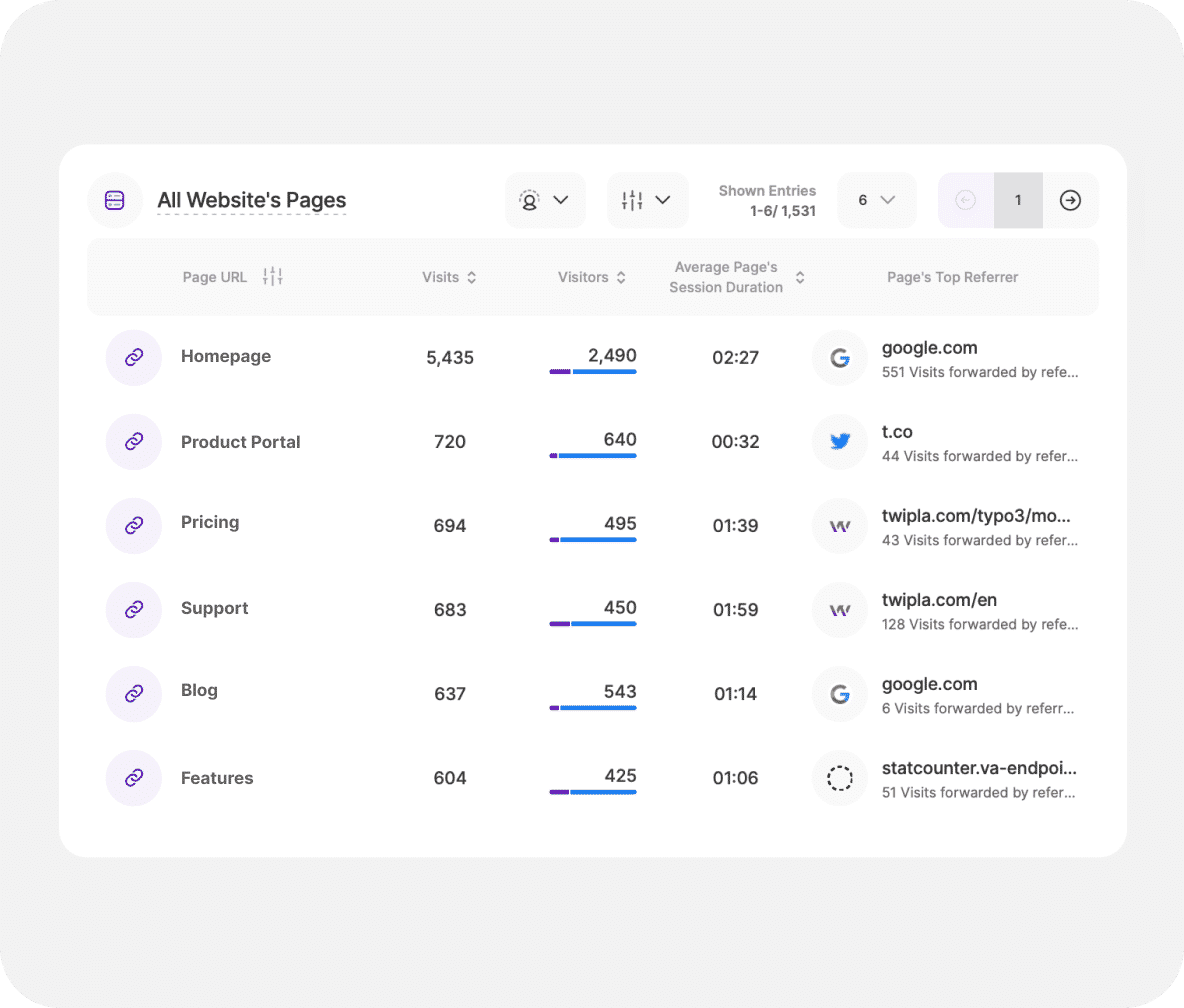
Page Performance Reports
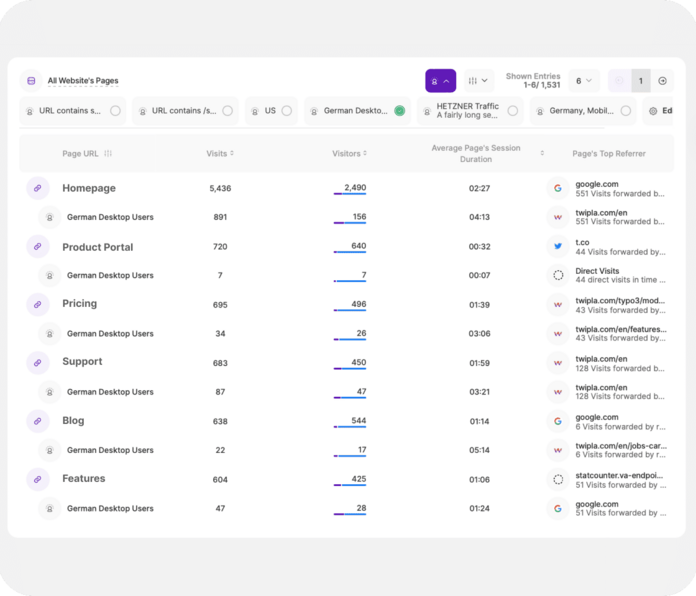
The Pages Dashboard displays all the high-level statistics on individual webpage performance, all in one collated reporting panel. Easily verify the effectiveness of your product pages, landing pages, blog articles, or whatever page type you want to focus on today.
See your pages ranked by visitors or visit count. Know the average session duration for each, as well as the referring site that's bringing in the most webpage traffic. Additionally, group your pages by up to the fifth page path and then see the cumulated statistics on each.
So jump into this dashboard and navigate your webpage metrics with clarity and control. Leverage the streamlined interface, where modern design meets user-friendly functionality. Then, use these insights to guide website optimization on a page or page-type basis.
Activate Dynamic Panel Filters
Go into the Pages Dashboard and quickly filter page performance data in any way imaginable. Enable a single filter or multi-level filter in just a few seconds. Or, toggle on a saved filter template that you use frequently and view only the data that matters to you today.
So customize what you see by filtering data across any dimension: visitor location, device type, new or returning visitors, UTM campaign source. Efficiently align any website intelligence work with specific marketing activities and better build optimization around end goals.
Or, activate a visitor segment in seconds to reveal hidden layers or synergies to your Pages Dashboard data with one click. Leverage this granular analysis to deep dive into the intersections between audience types and webpage effectiveness, and drive results.
Confirm Dashboard Insights With Users
Discover Visitor Communication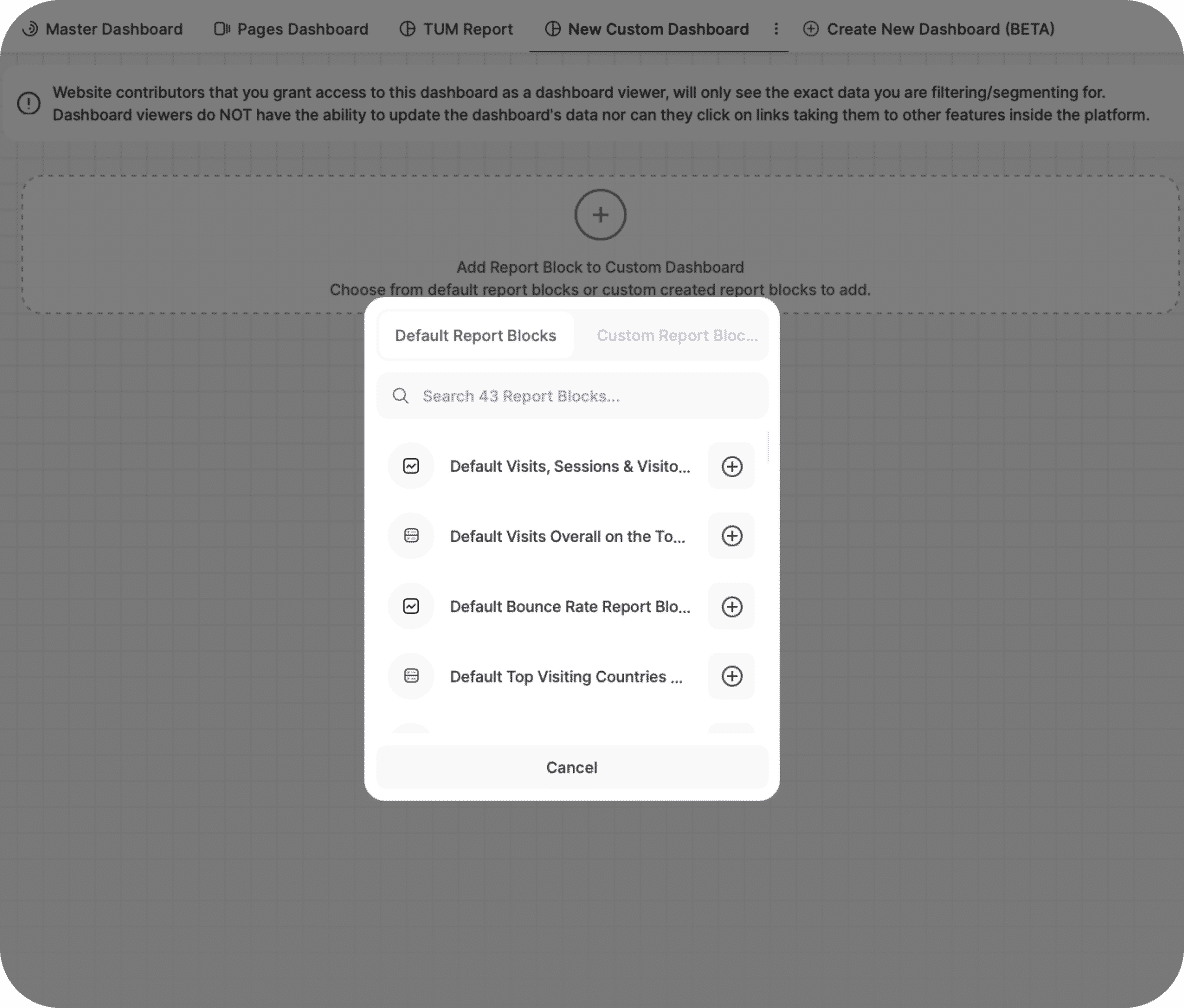
Create Custom Report Panels
The Custom Dashboard enables users to create dashboards that display whatever information they want. Use it to build custom boards that are tailored to your business. Personalize what TWIPLA shows, and speed up analytics by viewing only the data you need.
So create as many dashboards as you want from the 43 default report blocks or custom report blocks, with a mouse hover revealing what each looks like to simplify selection. And once done, use the intuitive drag-and-drop system to order them however you want.
Afterwards, name it for ease of reference. Add or remove different reporting blocks whenever you want. It's all fully customizable, just as you would expect from TWIPLA. Leverage Custom Dashboards, and shape our website intelligence solution around your exact needs.
Control What Contributors See
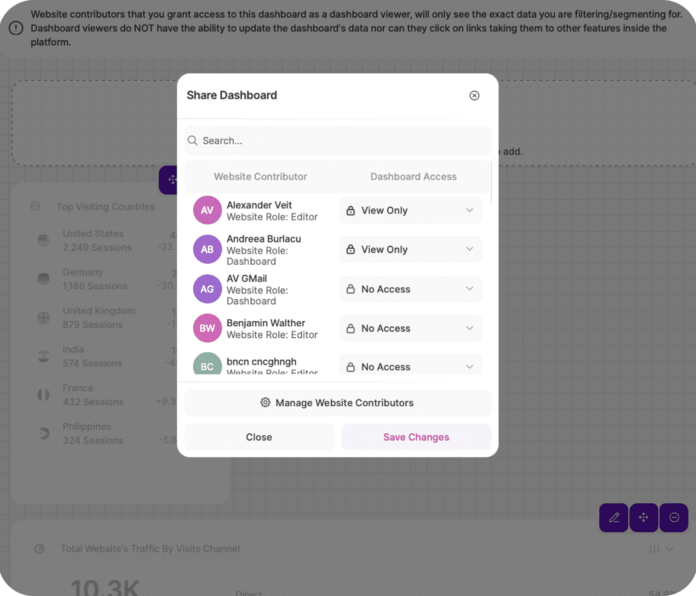
We have built our principle of data ownership into the Custom Dashboards, making it easy to control who can access reports. This increases data security, streamlines collaborative analytics, and makes TWIPLA a valuable tool for agencies and SaaS providers.
Controlling access is simple. Quickly pull up a list of any contributors. Choose which ones are editors, website watchers, or viewers of any specific Custom Dashboard. Invite new people by entering their email address, and see which of them haven't actioned the request.
So use this feature to decide which employees or IT support workers can access or edit sensitive data. Or, provide clients, freelancers, or agencies with only the reports that are relevant to them. Ensure effective data governance and increase trust across your businesss.