Devices
Optimize to Hardware & Software Choices
Use Devices' Insights to Improve the User Experience
Adapt to Visitor Preferences
Devices is a powerful website intelligence feature that enables businesses to understand hardware and software usage. This is vital insight for technical site optimization, as well as for building the quality user experience needed to grow traffic and engagement.
TWIPLA provides granular statistics on all the device characteristics that matter: hardware, operating system, browser, and resolution usage. So leverage these insights to inform layout and design decisions. Optimize to your audience and achieve end goals faster.
Why Use Devices' Insights?
- Enhance UX by tailoring site to popular technology.
- Make informed decisions about design and content.
- Keep pace with changing user preferences over time.
- Enhance website speed and compatibility with visitors.
Granular Visitor Devices' Analytics
Guide Technical Performance Optimization
See the Popularity of Hardware
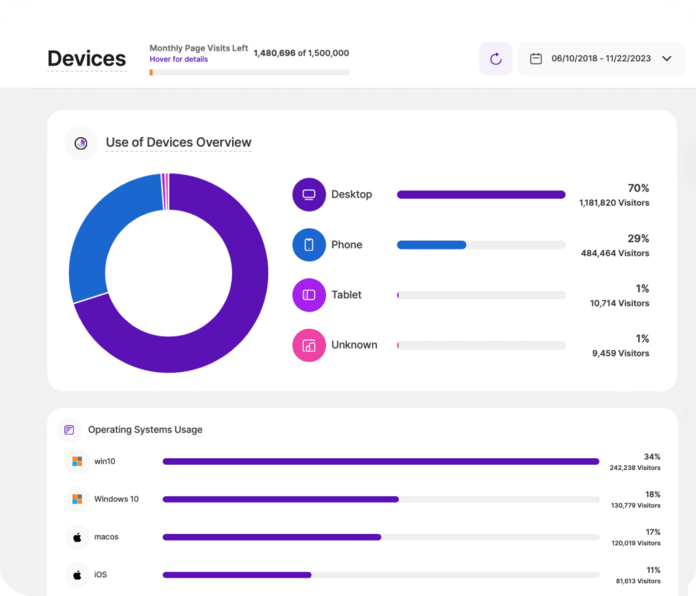
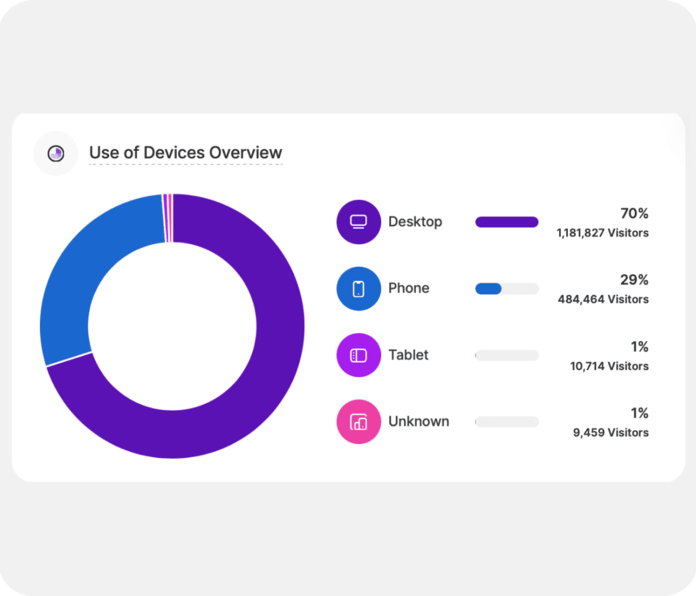
Jump into Devices and immediately understand the popularity of different device types with website visitors. Desktops, smartphones, tablets. This data is all here, enabling you to quickly make informed data-driven decisions about any website development priorities.
See the data intuitively displayed in pie chart form for ease of reference. View key data on traffic proportions alongside it. Instantly understand device-based user engagement, and use these insights to identify the best avenues for user experience improvements.
Then, go deeper. Activate a filter and see visitor device type trends visualized over whatever time frame you choose. So leverage Devices to recognize and adapt to changing user preferences and optimize your digital presence to the most-used device types.
Our User-Friendliness Extends Across the Platform
See the Industry Awards and User Reviews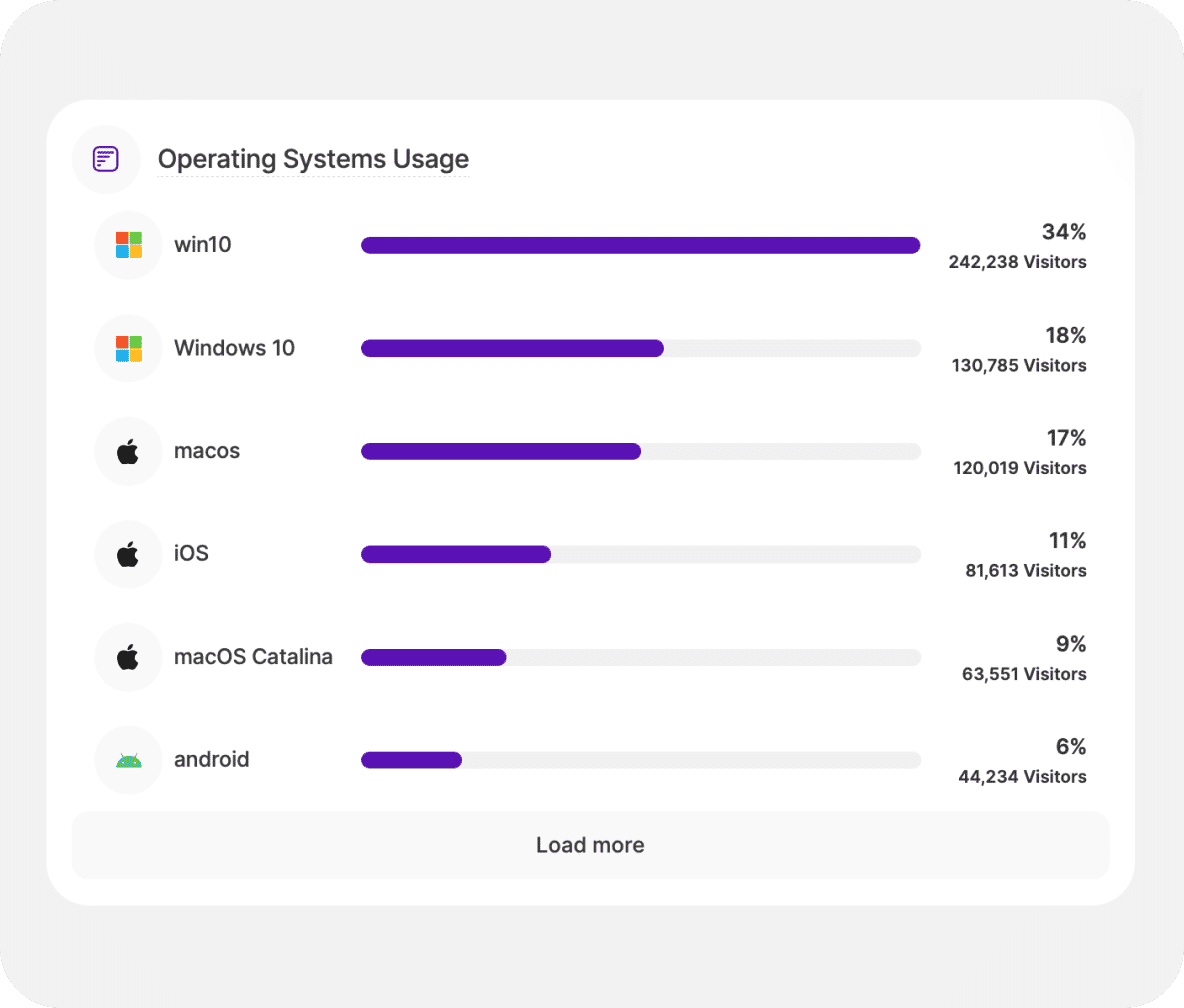
Adapt to Device Environments
Then, scroll down to learn about operating system usage. From Android to Linux, see a list of all the OSs ranked by popularity. Know whether visitors have outdated computing environments or the latest software, and use this insight to optimize technical performance.
See visitor numbers by OS and percentage of total traffic displayed in chart form for ease of analysis. Understand audience preferences side by side, and then use this intelligence from real data to guide effective budgetary and resource allocation decision-making.
Then, use the time filter options to see results over any time period you want. Track shifts in operating system preferences. Identify trends early and use this to know which technical optimization activities will best enable you to meet end goals in the long term.
See How Devices Impact In-Page Engagement
Discover Page Heatmaps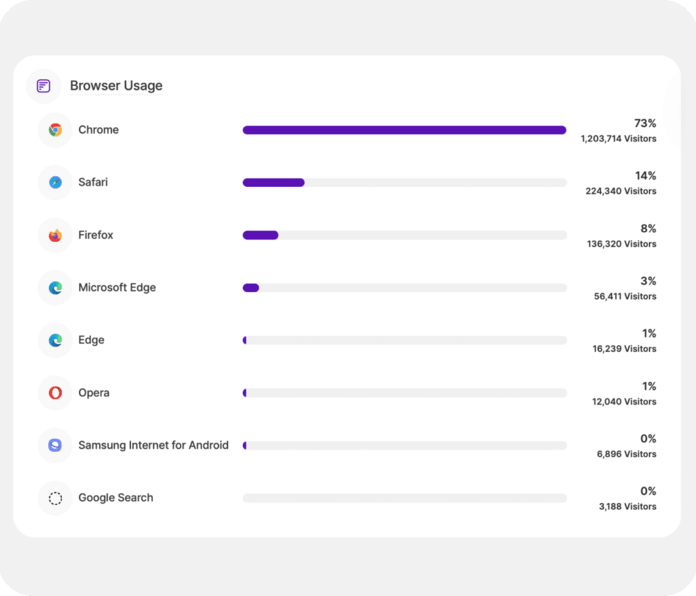
Rank Web Browsing Software
Alternatively, view key insights on website visitor browser usage. See traffic data segmented by browser preferences, and get a clear picture of software choices amongst your audience. View the data in graphic form, with a mouse hover revealing helpful information.
TWIPLA provides all the insights that matter, including total number of users for each browser and their share of total visitors. So know the popularity and relative use of each type. Then, make informed decisions about optimizing compatibility and site performance.
Additionally, filter browser usage by any time period. Observe trends and changes. Stay responsive to shifts in behavior and optimize functionality for the most used browsers. Use TWIPLA and get the insights you need to guide technical website improvements.
2.5m Businesses Use Devices' Insights
Read Some Client Success Stories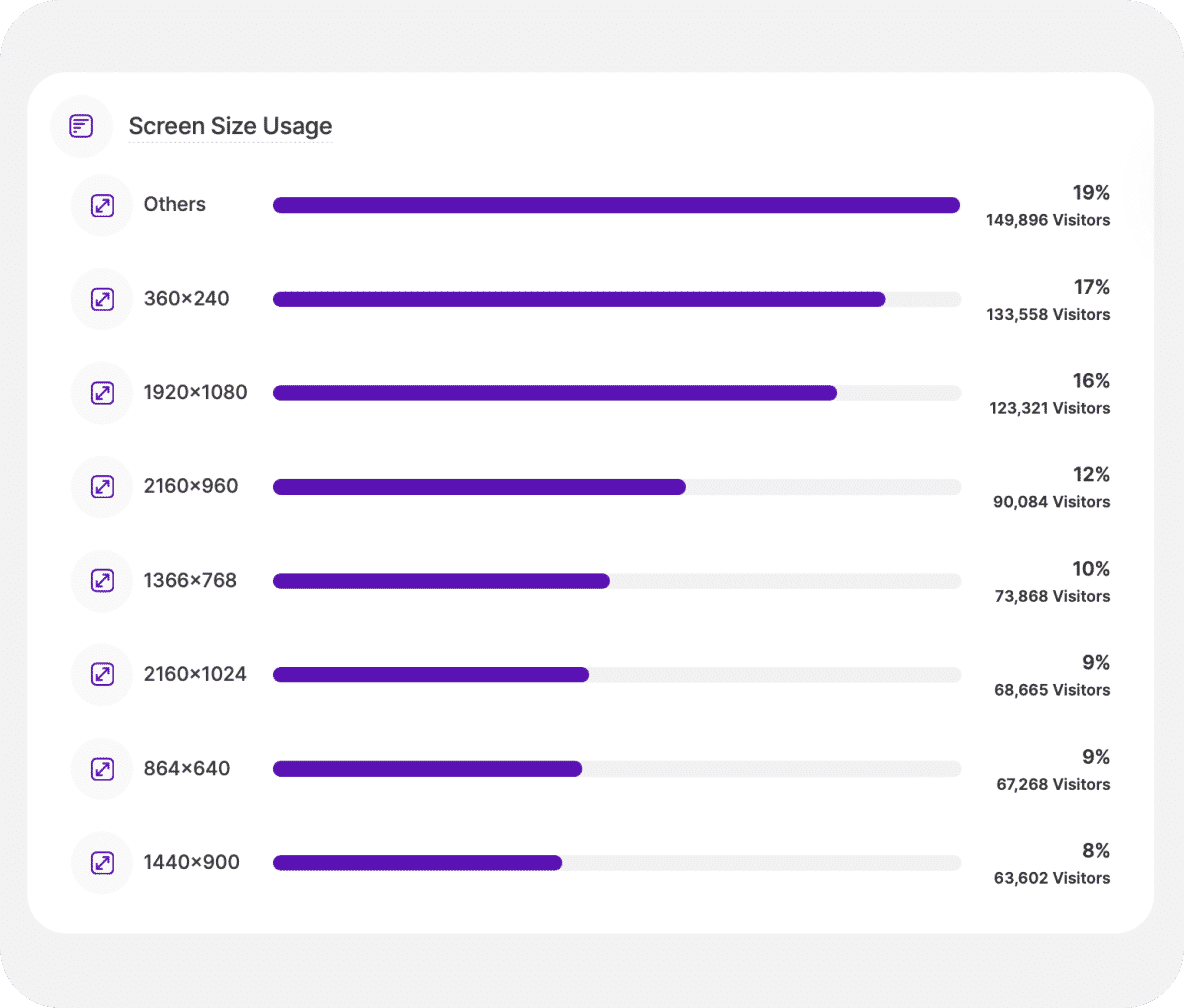
Know Popular Graphics Settings
Finally, understand screen resolution preferences. See traffic categorized by graphics settings, and get a clear picture of the diverse viewing environments of your audience that you can use to inform design and layout decisions. Then, see engagement soar.
TWIPLA provides detailed stats for each resolution, including both user count and the share of total traffic. So get a comprehensive understanding of resolution popularity, and then turn this knowledge into user experience improvements that your audience will love.
Then add a time filter, and see how the rankings change over any time frame. Stay ahead of changes in visitor device and monitor trends, and ensure the website remains visually appealing and functional across the most commonly used screen resolutions.