Website Intelligence News Roundup January 2024
Monthly Musings from the World of Analytics.

Simon Coulthard January 12, 2024

January's a funny old month as it feels like we're all shaking off the festive hangover and getting back up to speed with the working world. But writing this news roundup has been a real motivation, acting as a reminder of just how much we've still achieved here at TWIPLA.
We're launching our brand new eCommerce Statistics feature, which makes our platform all the more useful for online sellers. There's also been some huge improvements to the usability of our dashboards and event tracking tool, and we've made it easier to export data and calibrate notification settings - all changes that will help users to get the most out of our platform and personalize it to their needs.
And looking forward, we've got some exciting Webinars coming up over the next week. Our community portal is launching soon, and the Support Center has been updated so that users can fully understand all our new features. So have a read through and catch up with everything that's happened in the world of analytics!
What's Inside:
Upcoming Webinars.
In-House Activity.
Platform Updates.
- New feature: eCommerce Statistics.
- New visualization options for the Master Dashboard.
- Improvements to the Pages Dashboard.
- Updates to the Custom Dashboards.
- Our redesign of the Event Tracking feature.
- Improved data export functionality.
- Enhanced notification preference options.
Support Center Updates.
January's Blog.
Click on one of the links above to drop straight down to what interests you or keep scrolling down through the news roundup.
Unlock Your Full Potential
Our advanced website intelligence solution will enable anyone to grow their website quickly, while protecting visitor data rights. Sign up for free today, remove your ugly cookie banner, and supercharge data collection!
Upcoming Webinars.
1. How to Grow SaaS in 2024.
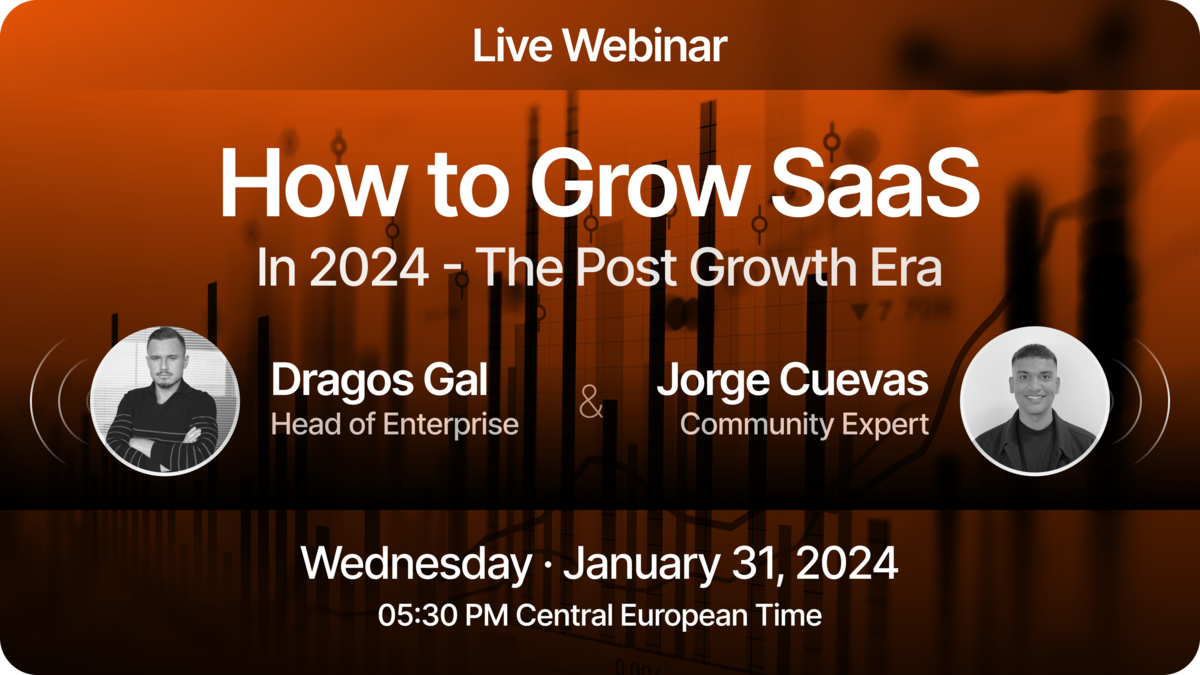
Join Dragos Gal and Jorge Cuevas as they share their insights and suggestions on how to navigate the Software-as-a-Service (SaaS) landscape as we race into 2024.
In it, they'll run through the paradigm shift into the post-growth era that these tech companies now find themselves working in, before introducing some practical strategies that SaaS companies can adopt to ignite success over the next year.
If you're interested in learning about why an increasing number of SaaS businesses are adopting martech as a way to grow revenue and differentiation without having to hire new staff or invest in the necessary infrastructure, then go ahead and register for the event!
2. How to Maximize eCommerce Insights Using TWIPLA's Full Website Intelligence Toolkit.

Wednesday, January 31st @ 19:00pm CET
For the Romanian speakers in our community, we have another Webinar in store for you, in collaboration with GoMag.
If you know anything about the Eastern European eCommerce market, you'll have heard of GoMag. They're a webstore builder with over 4,000 active sellers who have a combined turnover of €4 million. It's a great platform, and we developed our new eCommerce Statistics feature as part of our partnership with them.
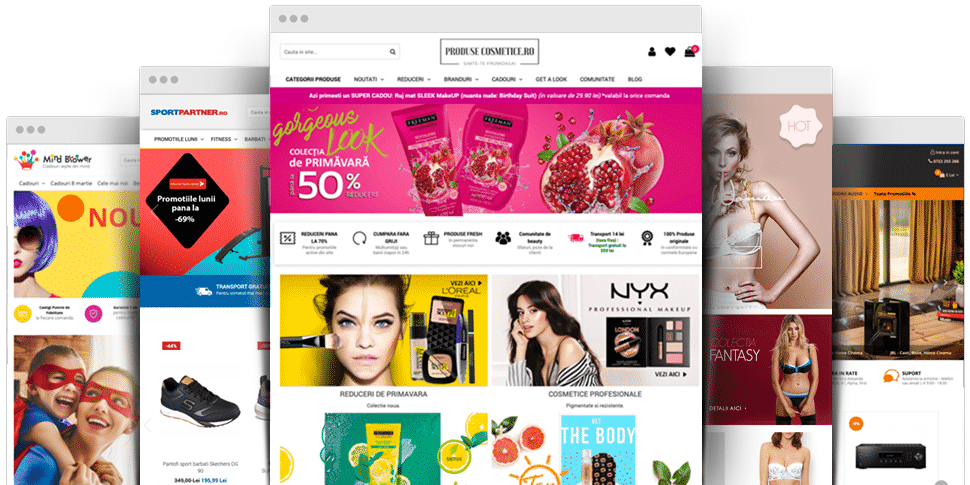
In this free Webinar, GoMag CEO Cosmin Daraban has invited our charismatic front-man Dragos Gal into the studio to discuss his experience with our eCommerce toolkit, and how it becomes all the more powerful when used together with other tools in the TWIPLA website intelligence arsenal.
It's a fascinating conversation, and one that will empower all eCommerce operators with more control over their webstore, increased conversion rates, and a stronger bottom line. You'll also get information about a one-month TWIPLA free trial for all paid plans that we're offering to the GoMag community.
If you're interested in attending this event, feel free to register for this event via GoMag's website.
In-House Activity.
Community Portal Updates.
Our community portal is really starting to take shape. We'd like to warmly thank everybody who completed the poll over the last six weeks; it's given us a huge amount of useful feedback regarding what the final form and focus will take, and we've taken it all on board.
We're expecting to launch this platform by the end of January. And after considering your opinions, it'll include a wide range of educational resources, training courses, an events calendar, and tips on how the get the most out of the TWIPLA intelligence suite. There will also be a discussion board to foster collaboration and cultivate a strong sense of community.
Overall, it's an exciting new venture that any businesses, marketers, and privacy advocates can use to better understand the privacy-first analytics landscape and get the online results they need faster so watch this space!
TWIPLA Wins More Industry Recognition.
Another month, another award - this time from Capterra. They've placed us on their 2023 analytics shortlist, meaning that this software review platform recognizes us as one of the top options on the market. We're all thrilled here at TWIPLA. It's our 62nd award since 2019 and it's great to win further industry credibility so early in 2024.
Platform Updates.
Our developers have surpassed themselves this month. Not only is our new eCommerce Statistics module launching next week, but they've also made some key updates in a number of exciting areas. These include improvements to all three dashboards, a redesign of our event tracking feature, and some new website and account settings to play with.
You can read the details below.
New Feature: eCommerce Statistics.
The day many of you have been waiting for has nearly arrived! After months of honing, testing, and perfecting, we're launching our brand new eCommerce Statistics module before the end of January.
This is an advanced toolkit that sellers can use to monitor and improve the performance of their webstore from every angle. Here's a little snapshot of what it has to offer:
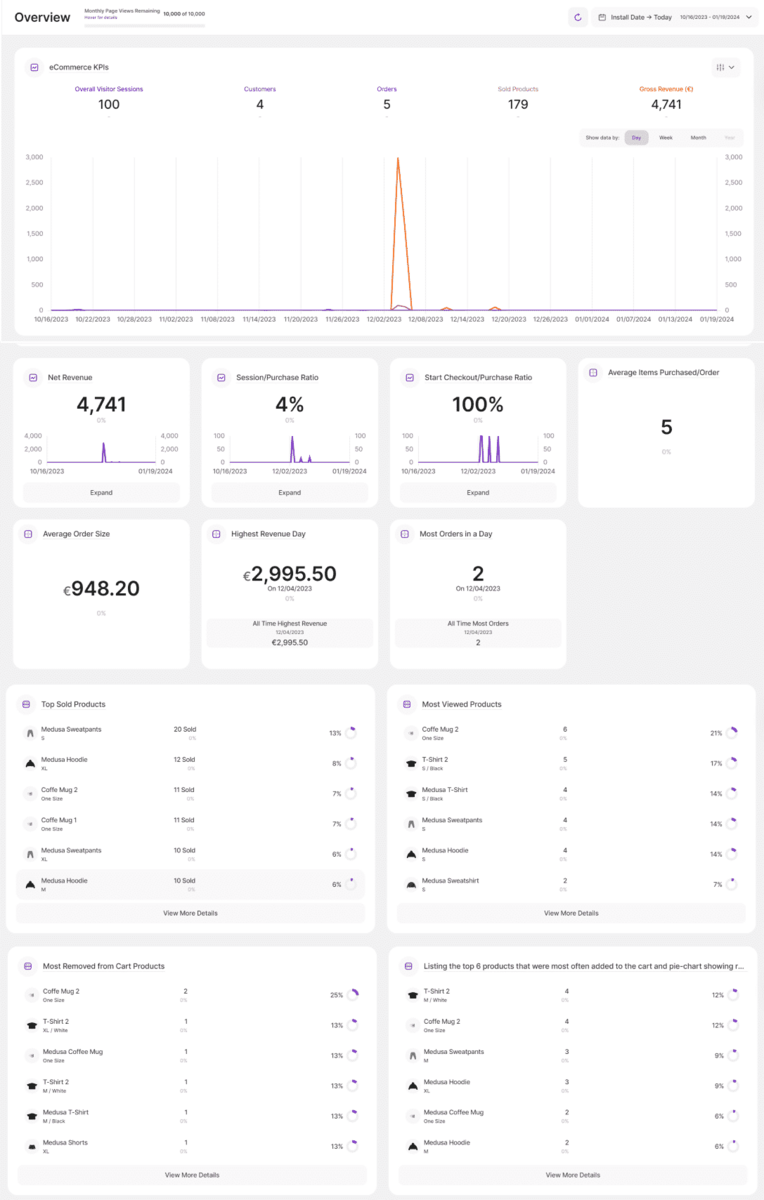
Overview
As you can see from the image above, this module contains all the top-level eCommerce KPIs that online sellers can use to monitor the overall health and development of their webstore. These metrics include:
|
|
|
|
|
|
|
|
|
|
|
|
|
|
Taken together, these metrics make it easy to analyze growth, engagement and revenue. Filter them down to whatever time period you want to look at or compare two time periods of your choice. It's all intuitive, and follows the same system as elsewhere in the platform.
Learn More About the eCommerce Statistics Overview
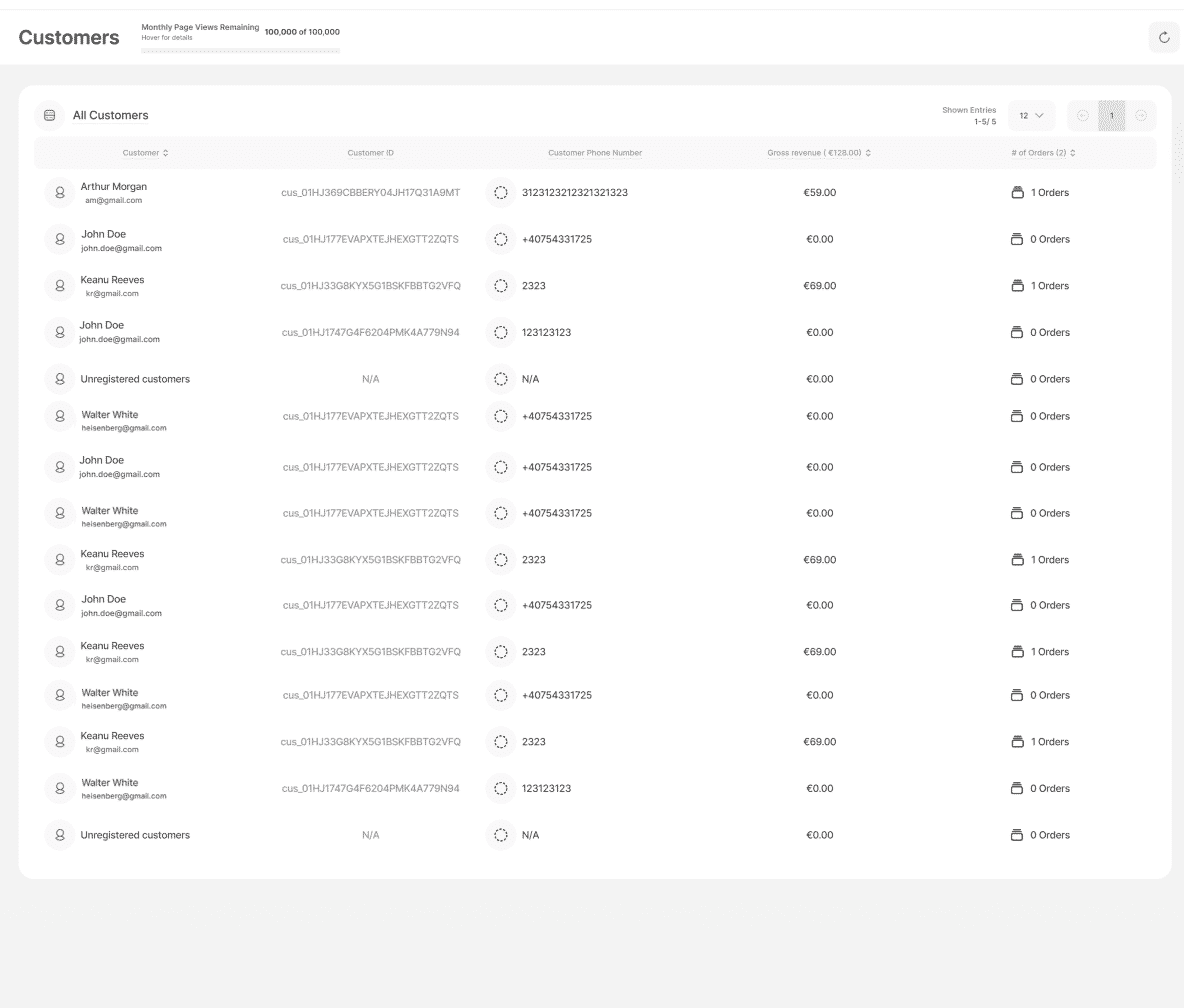
Customers
This second eCommerce Statistics module is a database that compiles all the contact information and purchase histories of everyone that buys from the webstore:
- Customer Name.
- Customer ID.
- Customer Phone Number.
- Gross Customer Revenue.
- Order Count.
This is vital information to have on hand for anyone running an online store. And armed with this client hub, you can quickly identify your top customers, monitor customer retention, and also find opportunities for personalized marketing and promotions that will get the clicks and purchase volumes you're looking for.
Learn More about the eCommerce Customer Hub
Sales Charts
This module has three submodules to give online sellers a 360-degree understanding of webstore sales:
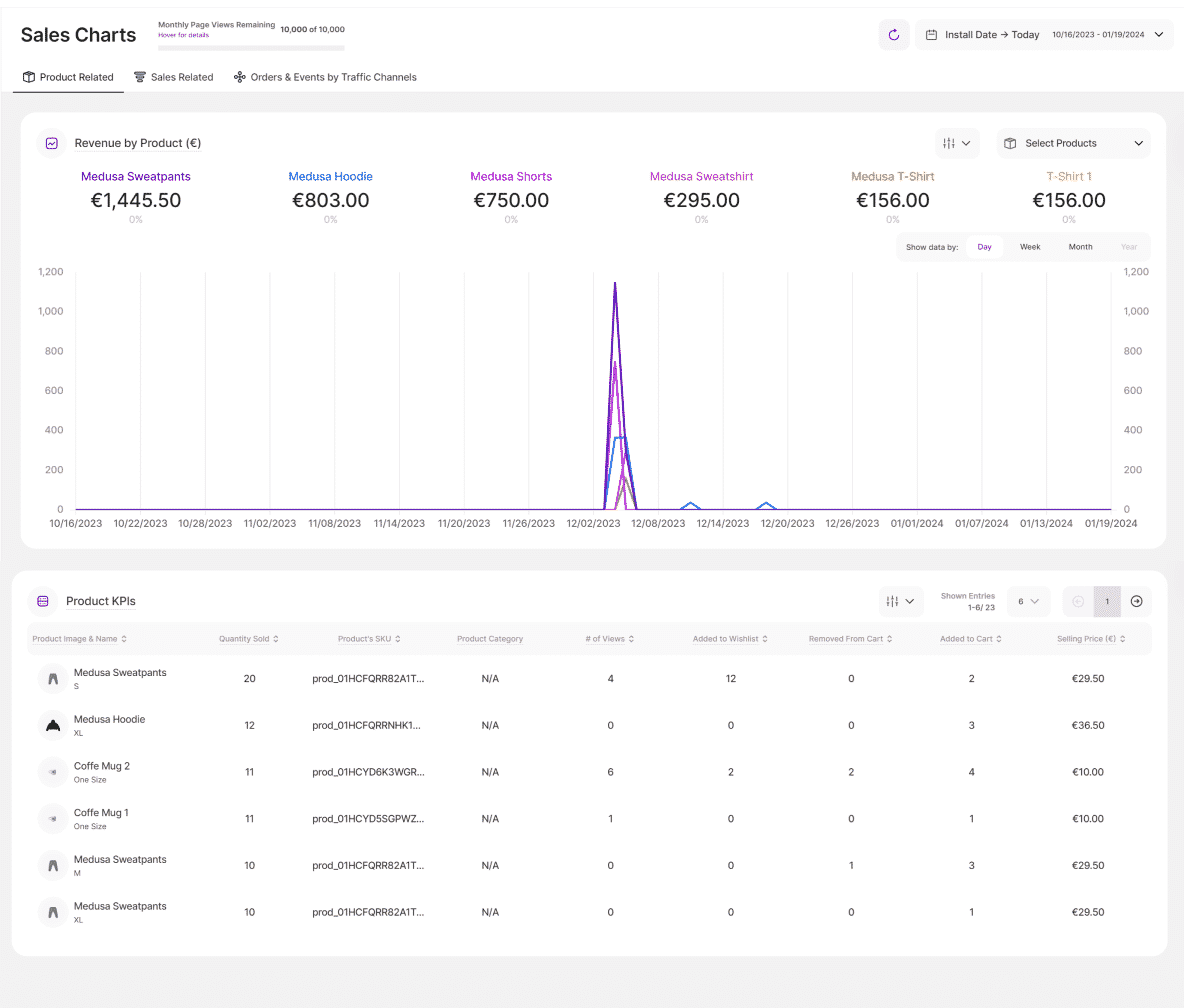
1. Product-Related Sales Charts
First up, sellers can analyze their sales from the perspective of products. Jump into the submodule and you'll find four report blocks that together provide all the important metrics:
- Revenue by Product.
- Units Sold per Product.
- Product KPIs.
- Product Lists.
And being TWIPLA, each of these report blocks includes an interactive graph that brings this data to life. View all items displayed on the same graph, or toggle between them to focus on specific products. Apply individual item filters or item categories and get a real feel for what's working and what's not.
Use this information to understand the profitability of different products. See them ranked by popularity, and use this insight to make informed inventory and marketing decisions.
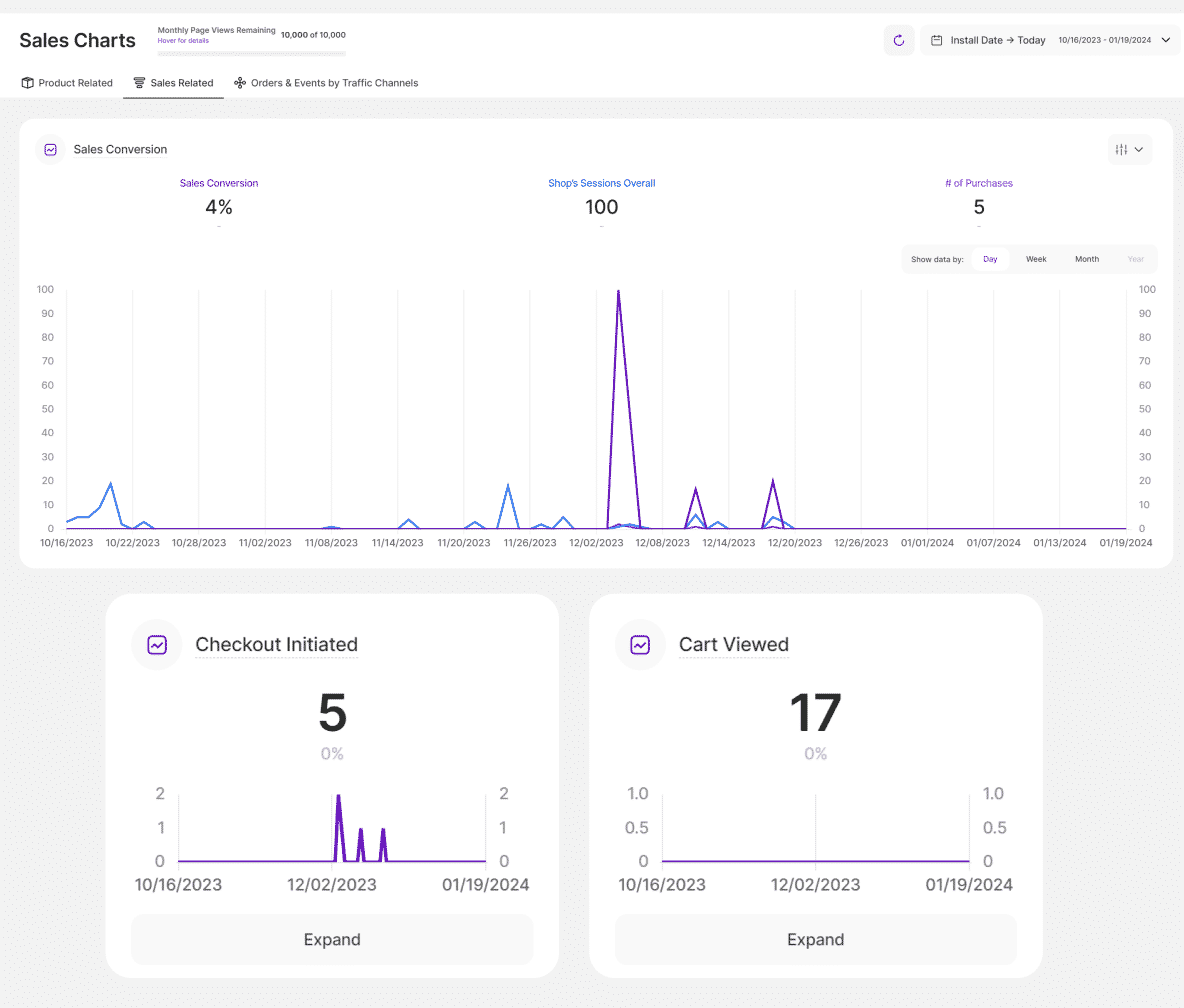
2. Sales-Related Sales Charts
Next, check out the sales-related submodule. This provides metrics that zoom in on the capacity of your website to delivery conversions:
- Sales Conversions (%).
- Total Session Count.
- Purchase Count.
- Checkouts Initiated.
- Cart Views.
It's no good having a great product inventory if your customers are put off by the webstore's purchase process, and this submodule provides the guidance you need to ensure that it works effectively. Use these tool to learn about the customer sales journey, and to find ways to optimize your cart, checkout, and wider sales processes.
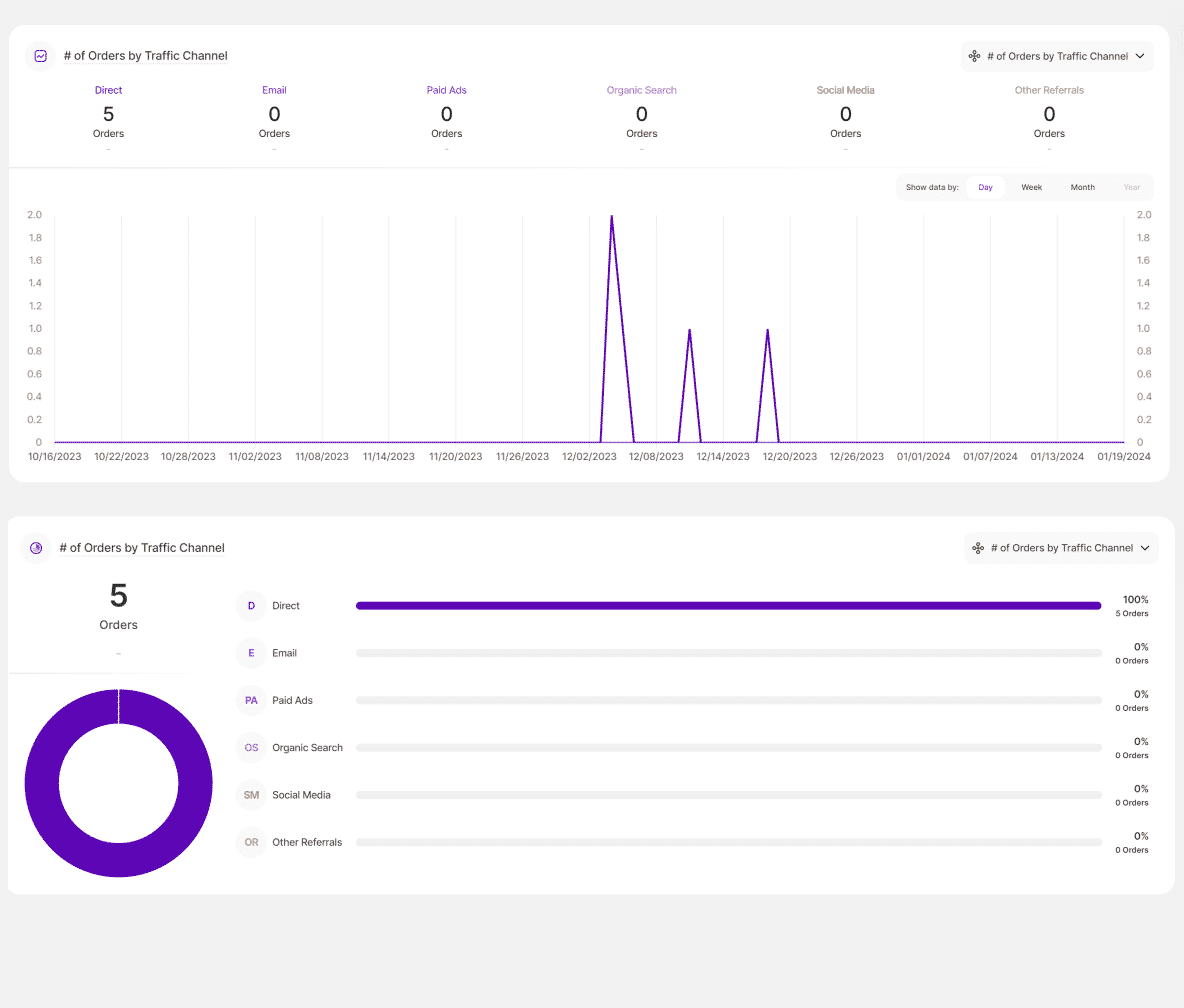
3. Orders and Events by Traffic Channel
Lastly, you now have an eCommerce submodule that analyzes sales from the perspective of customer source. Which of your digital channels bring in the most sales? Is it social media, paid ads, or email? Alternatively, it could be organic search, direct traffic, or something else.
So leverage these interactive report blocks to really drill into this data. Use this submodule to track orders and events from these different online sources, and then turn what you've learned into effective decisions about resource allocation and campaign optimization across your different channels. Focus on the channels that bring in money or improve those that don't - the choice is yours!
Learn More About eCommerce Statistics Sales Charts
As you can see, our eCommerce Statistics is filled to the rafters with all the guidance a webstore owner needs to effectively improve their business, make more money, and save time. It's powerful stuff, particularly considering that it comes packaged alongside our three pillars of website intelligence features. We're well-versed in the analytics game, and this module will really help eSellers to raise their game!
And if you want to learn more about the events that underpin the eCommerce Statistics module, go to the Support Center and you'll find all the information there waiting for you!
Master Dashboard.
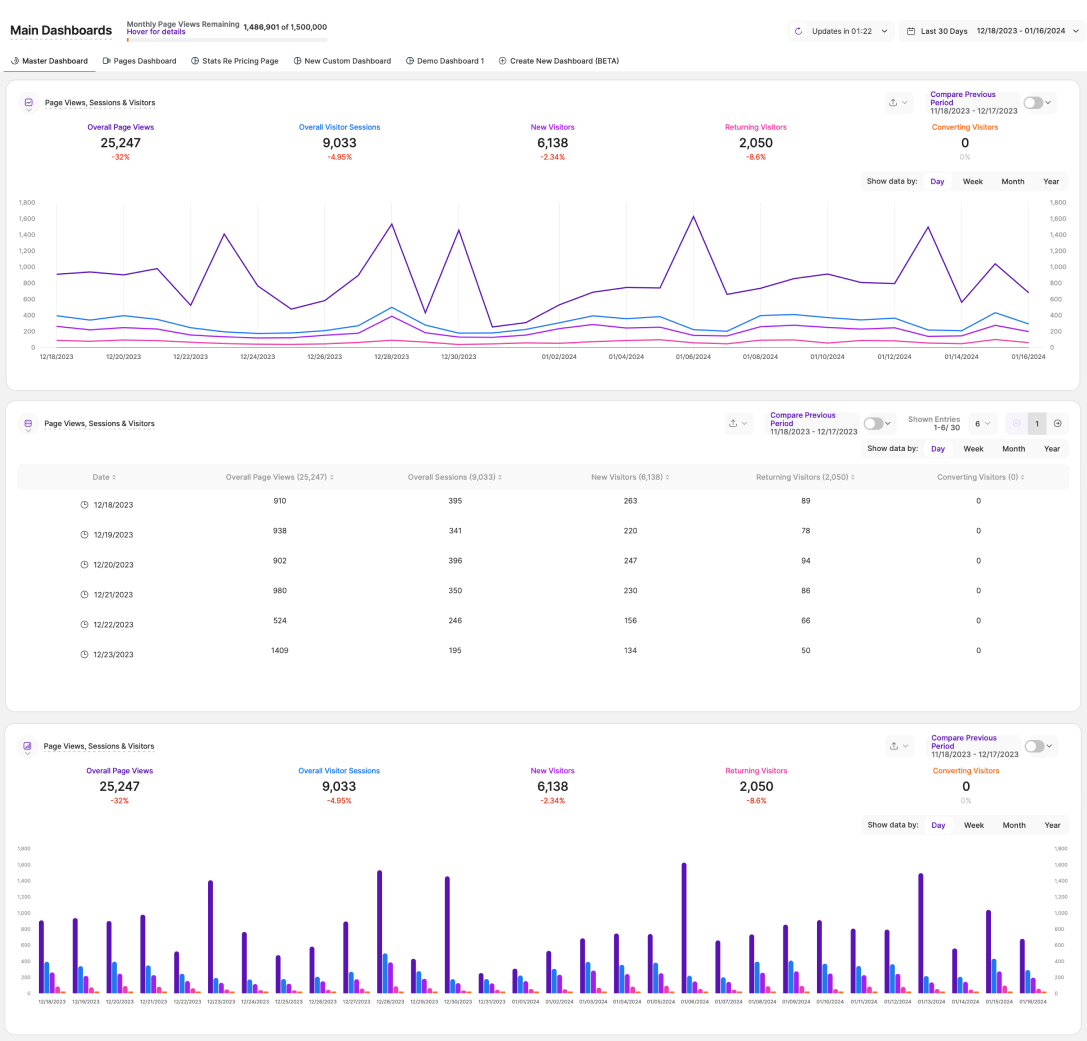
New Data Visualization Options
When you jump into the Master Dashboard, you'll find that clicking on the icon next to the heading of the [Page Views, Sessions & Visitors] report block reveals a drop down menu of additional visualization options. Click through them, and the data will now display in graph, table, or bar chart form.
This is a handy new feature that will soon be rolled out across many other TWIPLA report blocks, and offers users a number of exciting benefits:
- Choose graph mode to clearly see visual trends and comparisons.
- Switch to table mode to see precise data and insights.
- Jump to bar chart mode to see the different data points side by side.
This flexibility means that TWIPLA caters better to different analytics preferences, and means that users can extract meaningful insights based on their specific needs.
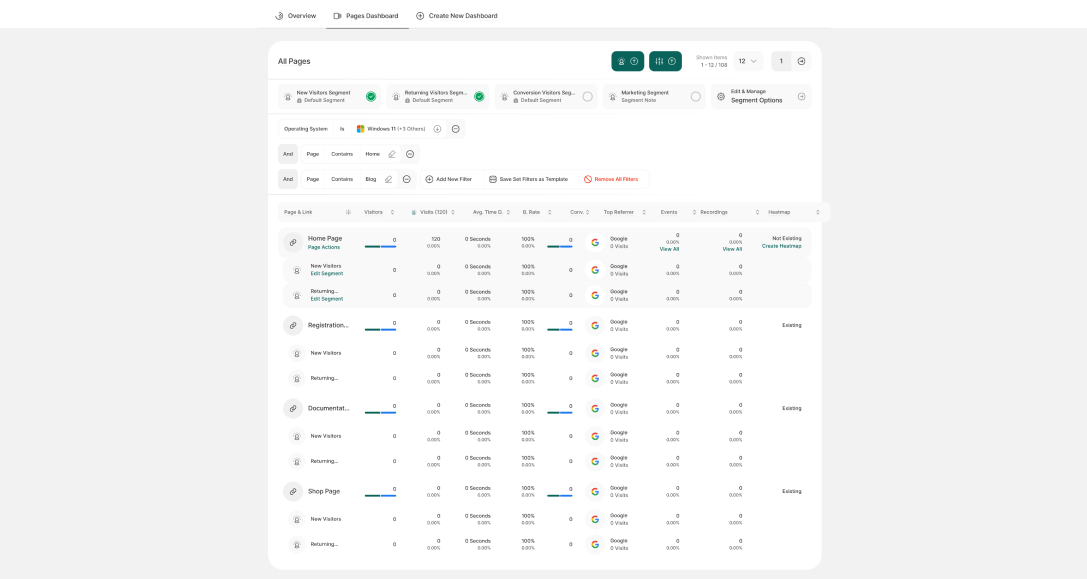
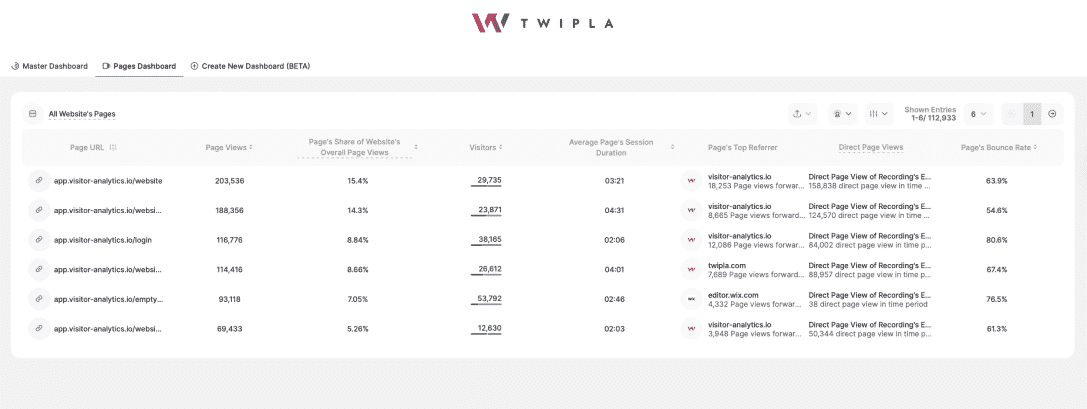
Pages Dashboard.
1. Visitor Segment Column Sums
Activate a Visitor Segment in the Pages Dashboard, and you'll now see sum totals in the Visits and Visitors columns, as well as a sum average in the Average Page Session Duration column. This was created on the request of a user and makes audience analysis more intuitive than ever.
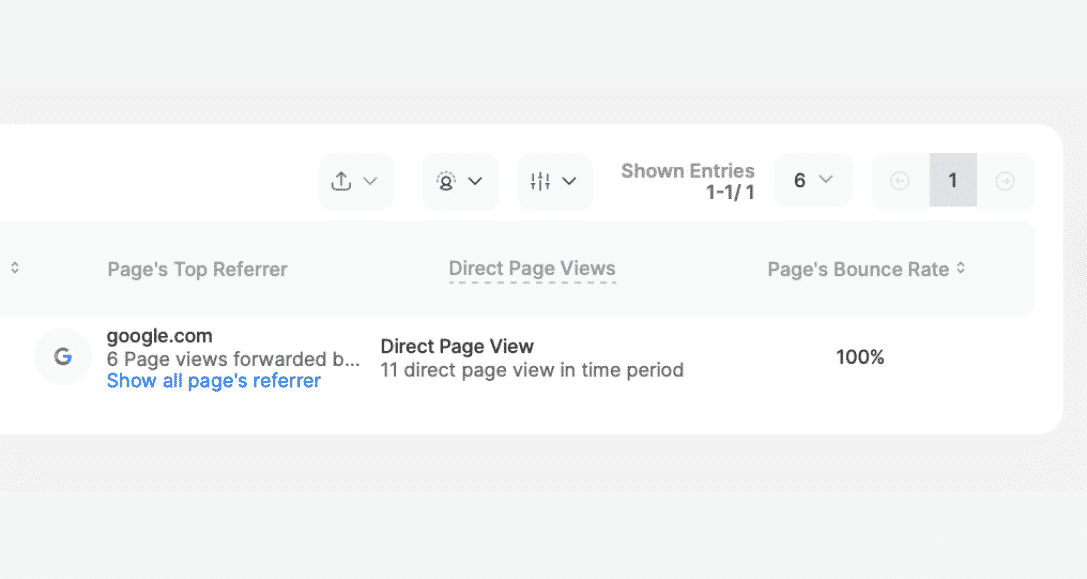
2. [Show All Page Referrers] Button
The Page's Top Referrers column previously only showed the leading referrer for each page, with the total number of visitors referred by this digital source during the selected time period. We've now improved this by adding a button that pulls up a ranked list of all the page referrers to speed up platform navigation.
Custom Dashboards.
Re-Nameable Report Blocks
It's only been a few months since we launched our Custom Dashboards, and they're proving really popular with our community. Agencies, SaaS partners, and businesses of all kinds are using them to streamline collaborations, tackle individual website development tasks, and improve the security of their data.
But our development team is far from finished! They've been gauging usage habits, listening to all the feedback from clients, and testing it from every angle imaginable.
One request we've been getting quite frequently over the last few months is for users to have the ability to rename the report blocks they add to their Custom Dashboards. This functionality has now been introduced, making it easier for them to match the name with whatever goals they've included the block for, or filters they have active within it.
This makes the Custom Dashboards more customizable than ever! And with custom report blocks also in the works, website owners will continue to find new ways to personalize our website intelligence platform to the specificities of their businesses!
Event Tracking.
We're always looking to make our platform more user-friendly. This is particularly the case with our Event Tracking feature which, by it's very nature, is the only tool that really requires some technical knowledge to use effectively.
But since our users found the previous layout a little difficult to understand, we've been working away under winter candlelight to make everything more intuitive and you can read key details from the redesign below:
- The landing module for the Event Tracking tool has been renamed from [Overview] to [Manually-Added Events].
- We've separated the manually and automatically-tracked events, with the later now given its own module within the tool.
- The automatically-tracked events module now only contains data related to the event category.
- This module table also now has a prominent [Show Event on Website] button.
Automatically-tracked events are pre-installed in-platform. These include text inputs, selects, and checkbox ticking and data capture can be easily toggled on or off at will. Manually-tracked events go further, enabling users to track any website event imaginable. This analytics can be activated by generating a custom tag and pasting the snippet into the element's source code.
Taken together, it's a powerful tool that users can leverage to really hone in on the website visitor behavior that is important to their business and goals. We've had some positive feedback about this redesign of the module and hope you like it!
Website and Account Settings.
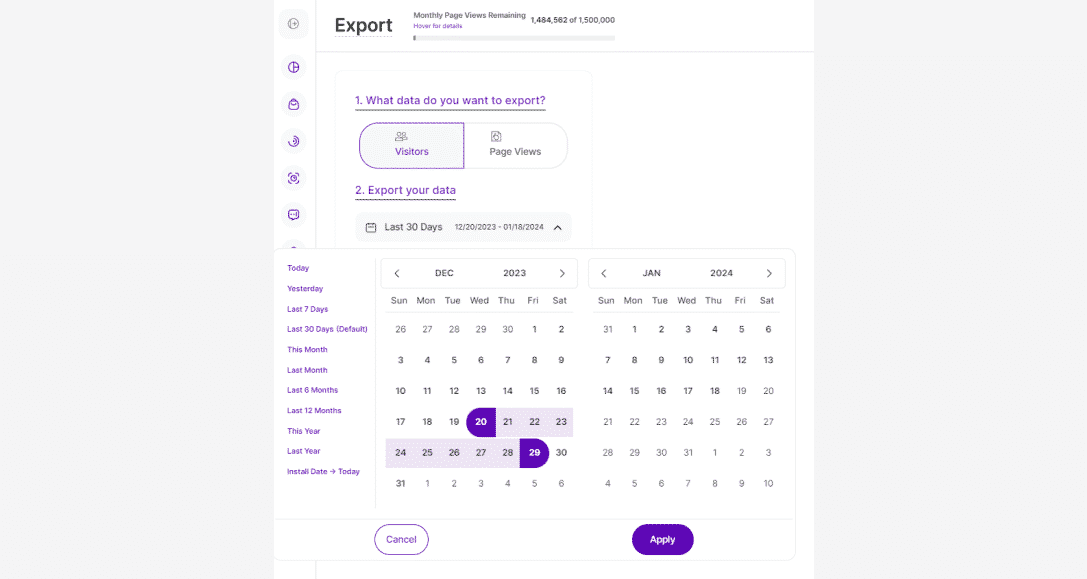
1. Data Export Functionality
As if our developers haven't been busy enough, they also found the time to refully rework the data export function. The result is that there's now significantly more data available to download using this feature, empowering users to utilize their website data in external tools, conduct further analysis, and make informed decisions outside of the TWIPLA interface.
This feature update aligns with our principle of data governance, serving to ensure that website owners have complete ownership over their information. Looking forward, we're also working to expand export functionality to encompass many more report blocks over the next few weeks so watch this space!
Visit the Data Export Support Center
2. Notification Preferences
We've given Standalone and Wix users more control over their notifications:
- Standalone users can adjust their notification settings by navigating to the [My Account Tab] in [Account Settings].
- Wix users can adjust their website email notification preferences in [Website Settings].
These new options will not impact the delivery of weekly reports. Instead, they enable users to decide whether they want to receive the monthly newsletter. as well as information on any discounts and promotions that we are running. It's just another way that we're giving users control over what they receive in their inboxes.
Support Center Updates.
Main Dashboards.
If you've made it this far down the news roundup, you'll have seen just how many improvements there have been to our three dashboards. And since these updates count for nothing unless our users have the information they need to use them effectively, we've also been busy updating this section of the support center.
But luckily we've got a great customer support team. Rona and Ben have been hard at work updating this information resource to include all these changes, and it's all looking pretty good now.
In the Main Dashboards Support Page, you'll now find guidance about the new data visualization options, how to create a new dashboard, and how to customize the report block names. There's also some more useful hints and tricks, as well as updated images.
Conversion Funnels.

We've been able to churn out so many exciting new TWIPLA features and improvements because of some impressive new infrastructure that we've written about in previous news roundups. It's exciting stuff, and there's more of it to come!
This means that our conversion funnels are now capable of automatically showing average funnel session time periods historically, meaning that the funnels will now show this data before they're created by users. They can also now quickly update the displayed data by adding a time filter.
And while these updates are all highly intuitive, we've updated the Conversion Funnel Support Page so that the information is there for all to see.
January's Blog.
How Agencies Leverage TWIPLA to Drive Growth and Versatility.

While TWIPLA is a powerful tool that any webmaster can use to guide website development, we also offer a white label analytics service for agencies and consultancies. This enables these businesses to integrate our website intelligence tools into service delivery, while also earning 30% commission on client signups.
Fully managed white label analytics is a fertile avenue for agencies looking to differentiate their offerings at a time of market saturation and industry stagnation, as well as to open up an effortless new income stream.
This blog introduces the concept of white label analytics for those new to the idea, before running through what has made our own service so popular with agencies and consultancies around the world.
Unlock Your Full Potential
Our advanced website intelligence solution will enable anyone to grow their website quickly, while protecting visitor data rights. Sign up for free today, remove your ugly cookie banner, and supercharge data collection!
That's All Our News from January 2024.
That's it! That's all the movement and changes that have happened at TWIPLA since before Christmas. It's great to see on one webpage just how much we've already achieved this year, and there's a real feeling around the office that 2024 is going to be our best year yet!
Thank you for joining us for the ride! If you want to keep pace with everything that's happening in the world of website intelligence, then the best way to do this is to subscribe to this monthly newsletter if you haven't already. And until next month, happy analytics!
Share article
Get Started for Free
Gain World-Class Insights & Offer Innovative Privacy & Security


Stay Updated & Get Inbox Insights
Keep pace with the world of privacy-first analytics with a monthly round-up of news, advices and updates!