TWIPLA Rolls Out New eCommerce Analytics Toolkit and Community Portal
Press Release January 2024.
FOR IMMEDIATE RELEASE.
January 30th, 2024. TWIPLA is proud to announce the launch of our advanced new eCommerce Statistics module. This new tool tailors our website intelligence toolkit to the requirements of online sellers, and gives them access to our globally-recognized, award-winning privacy technology that ensures the security of website visitor data and compliance with all international regulations by default.
The feature has gone through an extensive testing period in collaboration with our partner webstore builder GoMag, and will be rolled out for all our users this Wednesday, January 31st. And to celebrate the launch, GoMag CEO Cosmin Daraban and TWIPLA Head of Enterprise Dragos Gal will discuss the potency of this tool when used alongside the wider TWIPLA website intelligence suite in a webinar that's open to all.
TWIPLA Community Portal.
We're also excited about the imminent arrival of a new community portal. Website optimization used to be a simpler affair, requiring the analysis of basic website statistics. But today, success means knowing how to use a wide range of different visitor behavior analytics tools and communication modules, and also understanding how to use these options holistically to achieve goals. Given this, we're launching this community portal to arm businesses, marketers, and others with the information they need to make the most of the TWIPLA suite. It will provide a wide range of educational resources and community discussion boards, and will be available from Wednesday, 31st January.
Inside the Press Release:
This press release provides further details about the TWIPLA eCommerce Statistics feature and its submodules. It also includes more information about our SaaS and eCommerce webinars this week, the upcoming online community portal, and summaries of the main platform improvements and in-house activity of note since the last press release in November 2023.
Upcoming Webinars.
Wednesday, January 31st.
We've planned a double bill of webinars about website intelligence in the context of SaaS and eCommerce respectively.
The evening starts at 17.30 CET, and you can find details about each of the events below:

1. How to Grow SaaS in 2024 - the Post-Growth Era.
In this first webinar, TWIPLA experts Dragos and Jorge run through some of the main challenges facing tech companies as we move into 2024, before offering strategies to increase competitiveness and revenue. It will finish with an interactive Q&A session for anyone who wants advice specific to their business or sector. This free LinkedIn event takes place this Wednesday, January 31st @ 17:30 CET.

2. How to Use Analytics Data to Maximize Online Sales.
GoMag is a leading player in the Eastern European online webstore builder market. They're also a valued TWIPLA partner, and have provided invaluable support during the design, development, and deployment of our advanced new eCommerce Statistics feature.
To mark its launch, GoMag CEO Cosmin Daraban and TWIPLA Head of Enterprise Dragos Gal will be in the studio discussing how this tool grows even more powerful when used in conjunction with the wider TWIPLA toolkit. Data is key to online retail success in 2024, and these two experts offer advice for how eCommerce sellers can use this resource to drive sales and stand out in a crowded marketplace.
This 60-minute talk is in Romanian, and is followed by a Q&A session. It takes place Wednesday, January 31st @ 19:00 CET (20:00 Romanian time). Attendance is free, with registration available via GoMag's site.
Important In-House Activity Since November.

TWIPLA's New Online Community Portal Arrives This Week.
We're also launching our community portal this Wednesday, 31st January. And after considering the huge amount of feedback we collected in a recent poll, it will include a wide range of educational and training resources, an events calendar, and useful tips and tricks for getting the most out of TWIPLA. There will also be a discussion board to foster collaboration and cultivate a strong sense of community.

TWIPLA Added to Capterra's Shortlist of Best Analytics Tools.
We're proud to announce that TWIPLA is now one of Capterra's recommended website analytics platforms. Capterra is one of the most well-known online software review sites, and this industry award is further recognition of the capacity of our tool to help businesses and digital marketers achieve online goals. It brings our tally of awards for usability, affordability, and user satisfaction since 2019 up to 62.

Why SaaS Companies Are Choosing TWIPLA.
Our Analytics-as-a-Service enables SaaS companies to seamlessly integrate our analytics tools into service provision, either under their own branding or using the dual-branding option. This gives their end-users more reasons to sign in or upgrade payment plans, making it a fertile avenue for businesses that are looking to increase revenue without having to invest money or manpower in new technologies.

How Agencies Leverage TWIPLA to Drive Growth and Versatility.
TWIPLA has also developed white label analytics for marketing agencies and consultancies, who receive a 30% commission on client subscriptions. This was one of our biggest success stories from 2023, proving popular with businesses that recognize the capacity of this service to drive revenue growth and differentiation at a time when economic realities are limiting profitability for the sector.
Platform Updates.
New eCommerce Statistics Tool.
TWIPLA is already renowned for our advanced website intelligence solution. We've now turned our attention to online retail, introducing an advanced analytics toolkit that sellers can use as an intuitive guide to increasing clicks, sales, and revenue. It includes three vital modules:
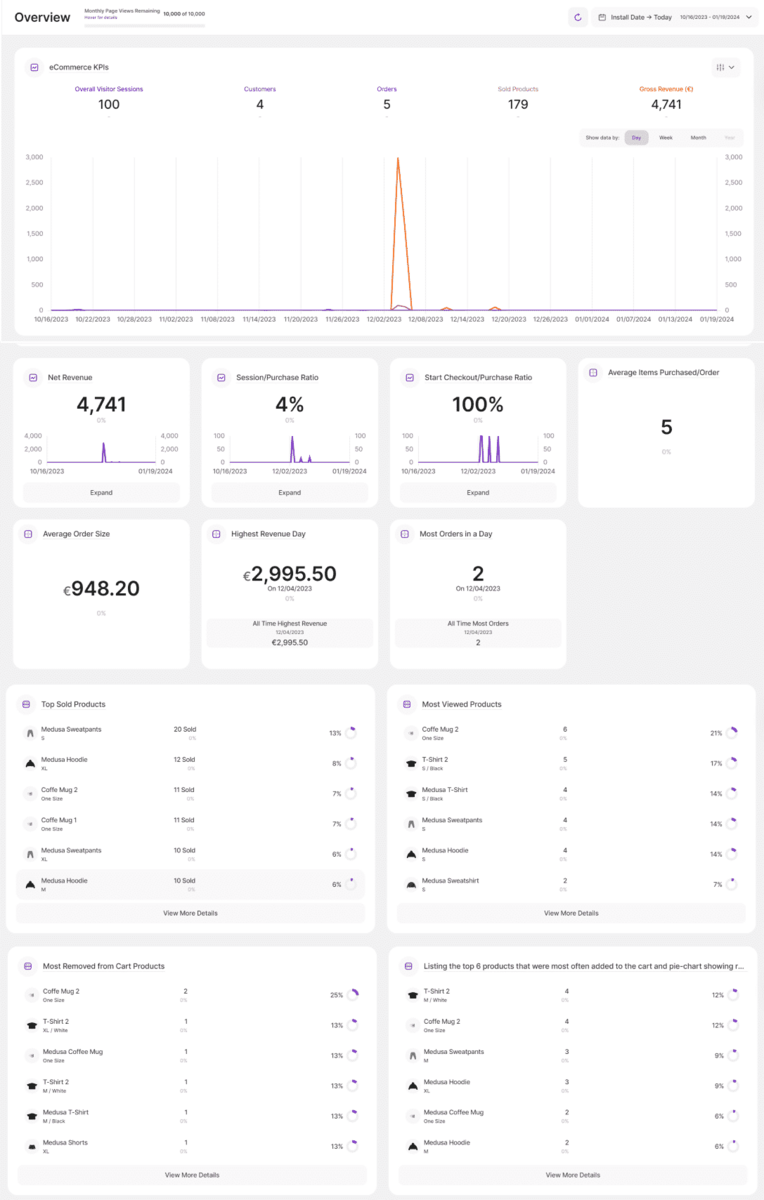
1. Overview
This first module provides online sellers with all the top-level KPIs they need to understand the overall health and development of their store:
- Total Visitor Sessions, Start Checkout to Product Ratio.
- Customer Count, Average # Items Ordered, Order Count.
- Average Order Value, Sold Product Count, Gross Revenue.
- Highest Revenue Day, Highest Sales Day, Most-Viewed Items.
- Most-Sold Products, Session/Purchase Ratio, NET Revenue.
These metrics are all also displayed in interactive graph form where practical. Data can be restricted to any time period, and compared historically so that sellers can understand the impact of webstore optimization activities, as well as seasonal and wider market trends.
Users can leverage the Overview module for a top-level view of webstore performance by day, week, month, or year. Alternatively, they can click into any of the included report blocks to quickly dive deeper into whatever insights they want to explore further.
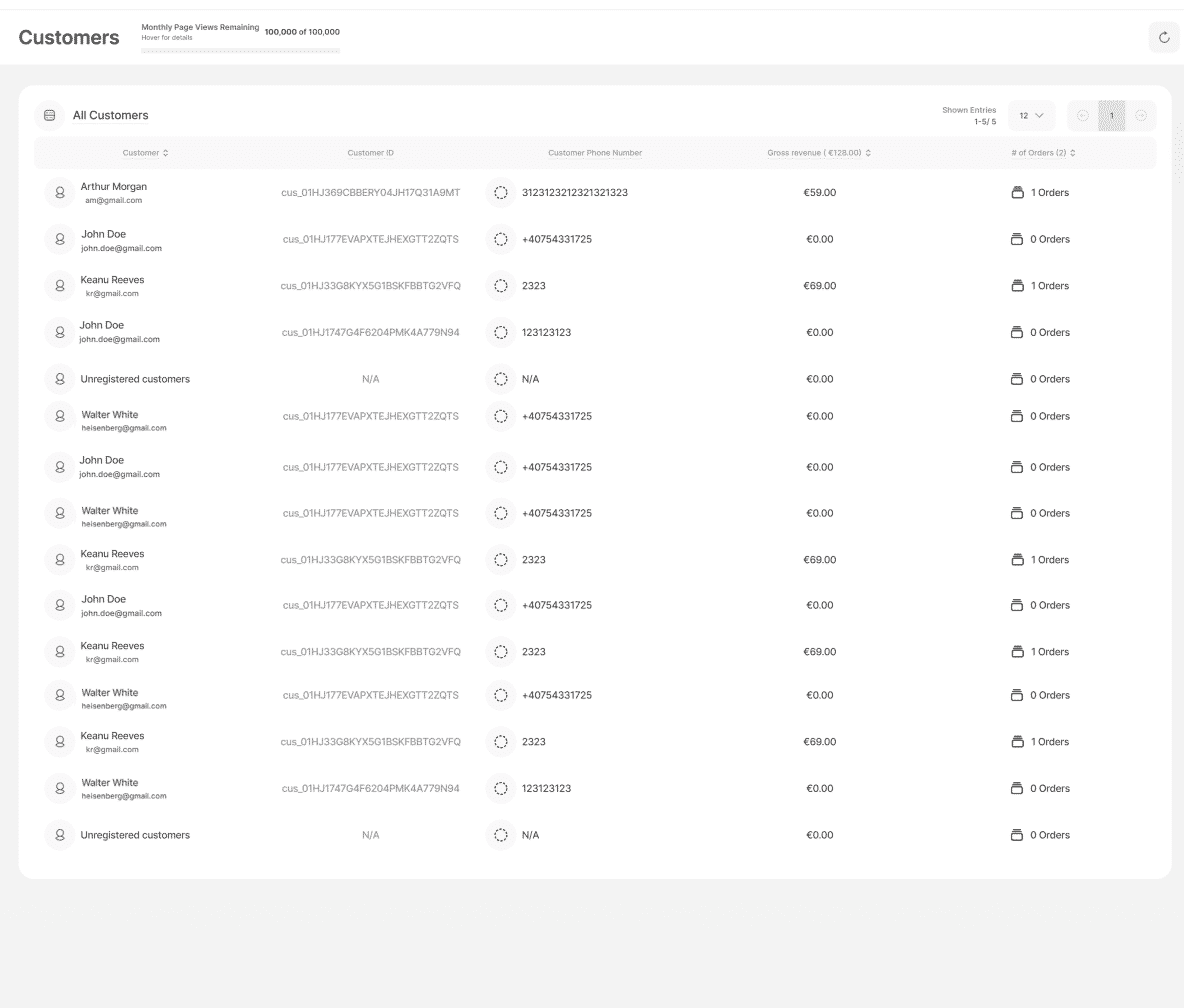
2. Customer Database
This second module provides all the contact information and historic purchase records of everyone that has bought from the webstore:
- Customer Name.
- Customer ID.
- Customer Phone Number.
- Gross Customer Revenue.
- Order Count.
Users can take advantage of the Customer Database to pinpoint their high-value customers, monitor loyality and retention, and identify opportunities for personalized marketing and promotional initiatives.
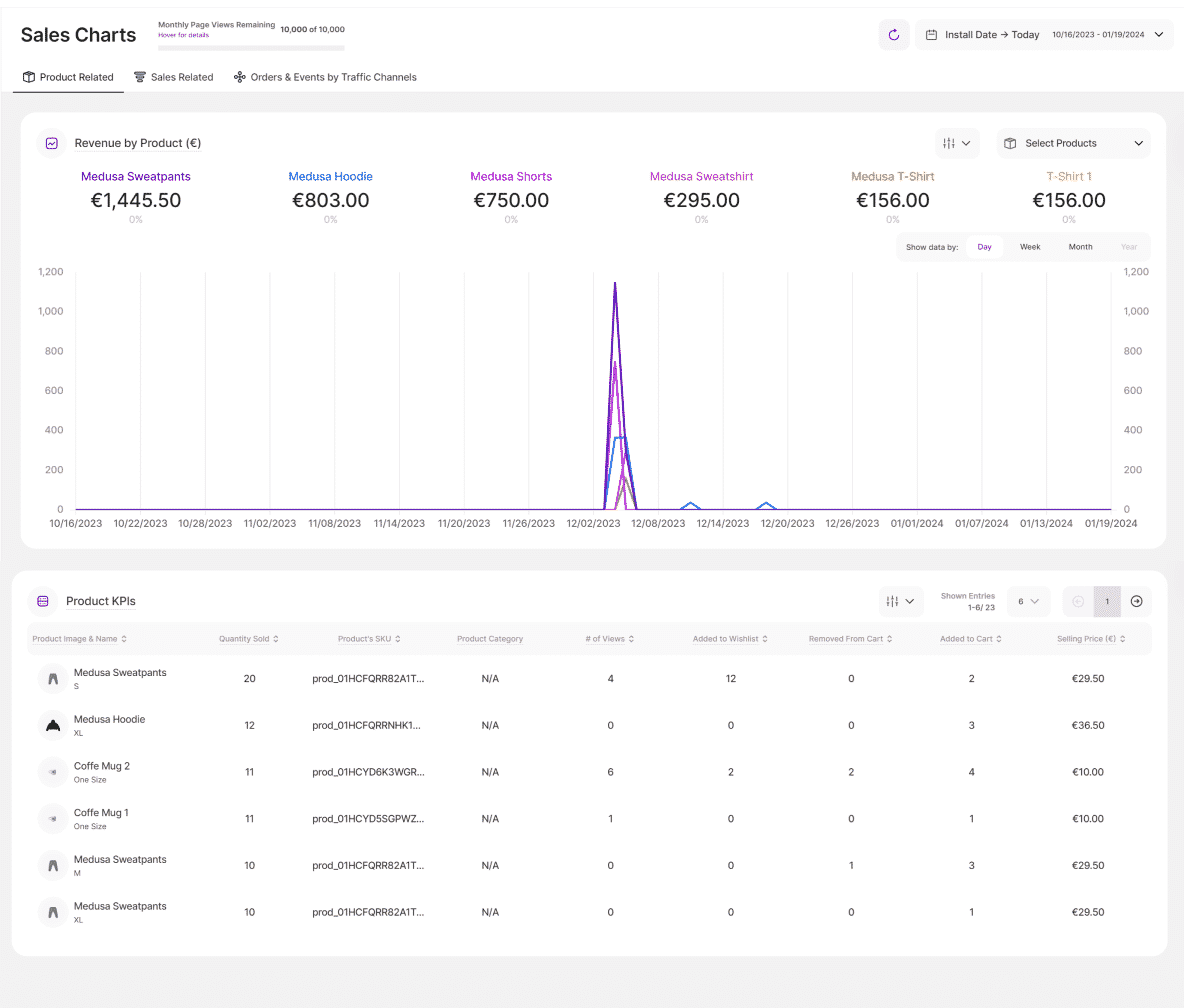
3. Sales Charts
This final module provides eCommerce businesses with the granular understanding of sales they need to optimize product inventories, purchase processes, and the performance of all their digital channels:
⟶ Product-Related Sales Charts
Online sellers can gain insight into the profitability and popularity of their different products, and make informed, data-driven decisions about their inventories, stock levels, and wider marketing initiatives.
⟶ Conversion-Related Sales Charts
Users can focus in on the capacity of their webstore to facilitate sales and analyze customer journeys, and then use this data as a guide to optimizing store design, cart, checkout, and wider sales processes.
⟶ Orders and Events by Traffic Channel
eCommerce businesses can also analyze the capacity of their digital channels at driving sales, and they can use these insights to dictate priorities, shape promotional marketing campaigns, and so forth.
Redesign of Event Tracking Tool.
As part of our ongoing efforts to maximize the utility of all our features, we've completely redesigned the Event Tracking module that enables users to calibrate our platform to their exact business requirements.
Automatically and manually-tracked events have been separated into their own submodules, and labeling has also been improved throughout the tool so as to create a far more intuitive interface.
Users can still activate or disable auto-tracked events in [Module Settings]. But in the new Auto-Tracked Events submodule, they will now find buttons that take them to a preview of each event in-page.
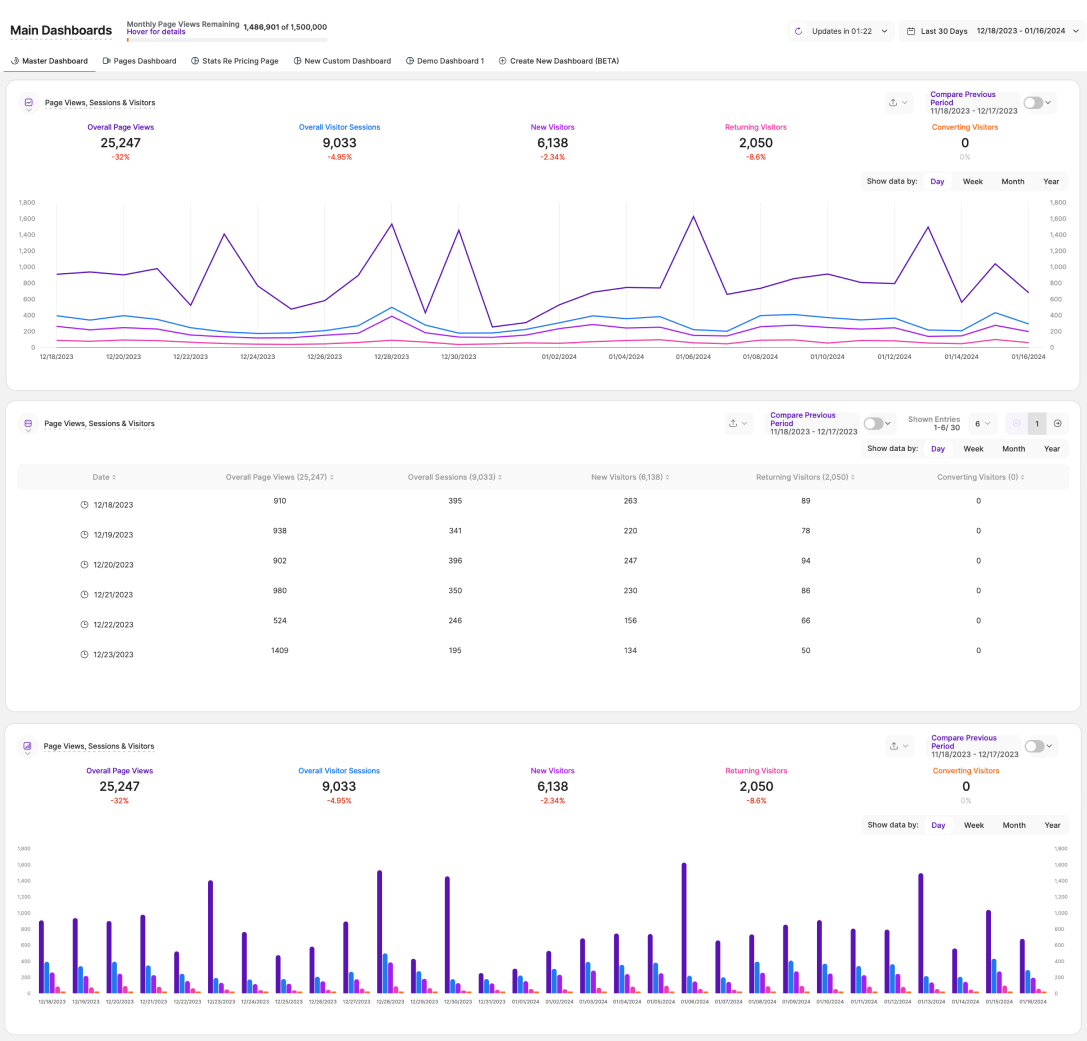
Main Dashboards Improvements.
1. Master Dashboard
The [Page Views, Sessions & Visitors] report block includes two new data visualization options, meaning that users can now see their insights displayed in graph, table, or bar chart form. This functionality will soon be rolled out across the TWIPLA platform, and offers users a range of benefits:
- Choose graph mode to see visual trends and comparisons.
- Switch to table mode to see precise data and insights.
- Go to bar chart mode to see different data points side by side.
This flexibility means that TWIPLA caters better to different analytics preferences, and means that users can extract meaningful insights based on their specific needs.
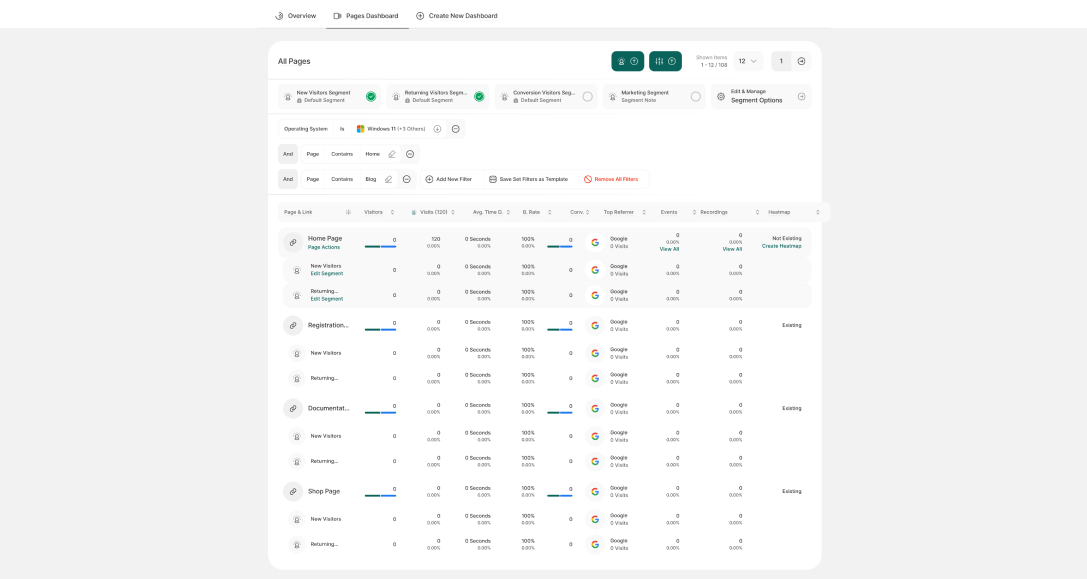
2. Pages Dashboard
⟶ Visitor Segment Column Sums
When users activate a Visitor Segment in the Pages Dashboard to hone in on specific audience demographics of interest, they can now take advantage of sum totals in the [Visits] and [Visitors] columns, as well as an overall average in the [Average Page Session Duration] column. This has been deployed on the request of a user and makes segmentation analysis far more intuitive.
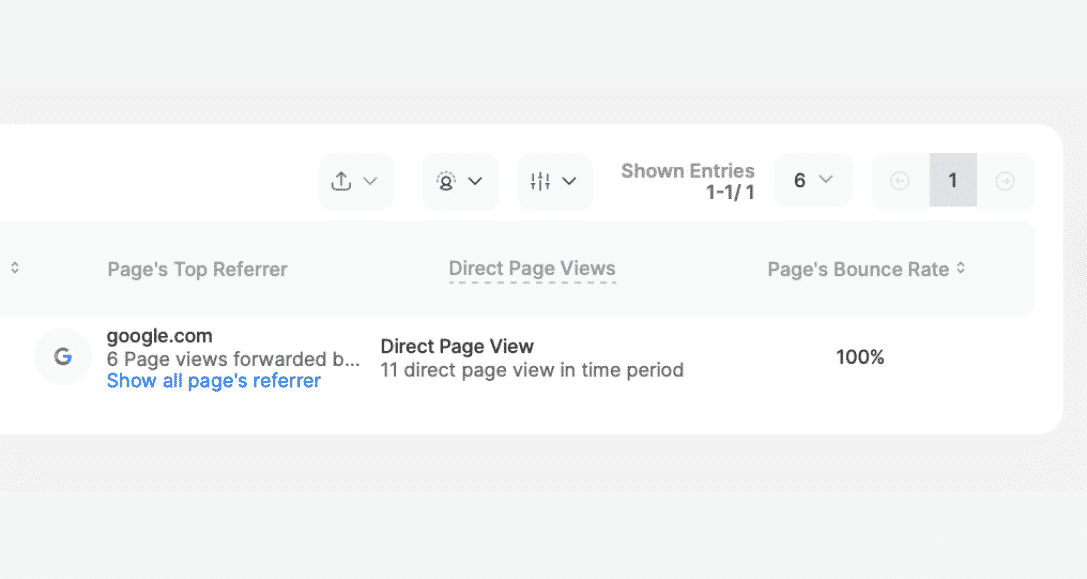
⟶ [Show All Page Referrers] Button
The [Page's Top Referrer] column previously displayed the top referrer for each webpage, as well as the total visitor count referred by this digital source. This information is now complemented by a button that pulls up a list of every referrer behind webpage traffic, ranked by visitor numbers from this source. This makes the Pages Dashboard far easier to navigate, and enhances referral analytics significantly.
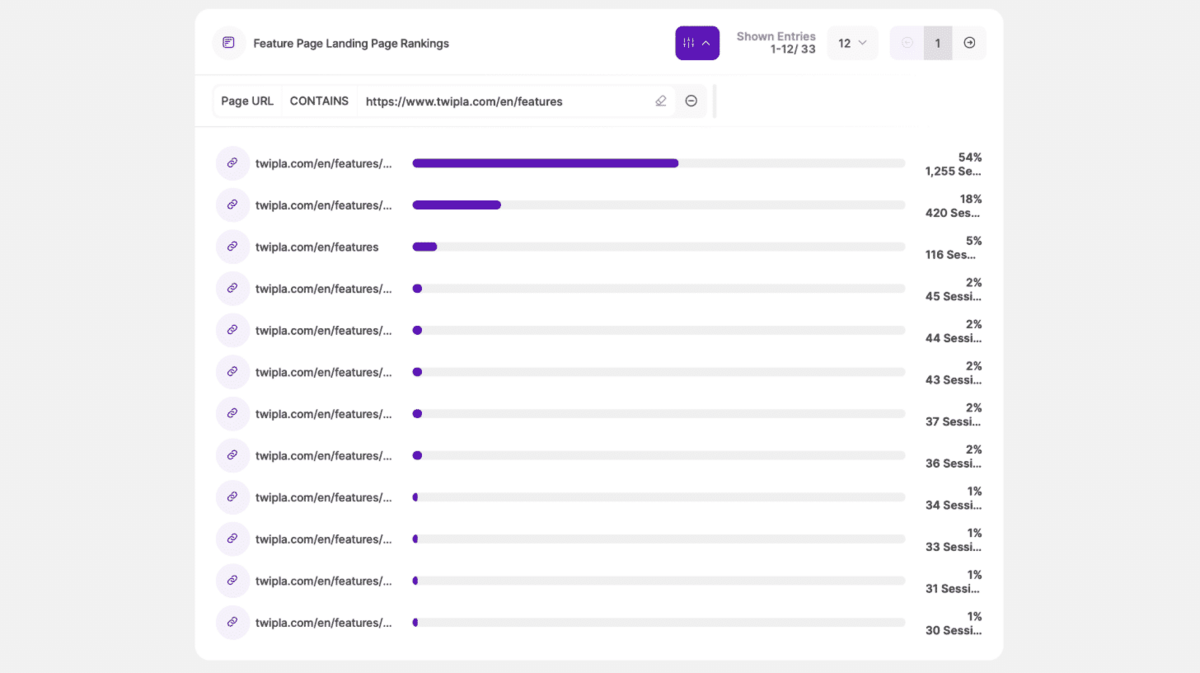
3. Custom Dashboards
TWIPLA users can now rename any of the default report blocks they add to a custom dashboard, as well as the name of the dashboard itself. This makes it easier for them to match the name with the objectives they've activated the report block for, and any filters they've included to the data within it. And with custom report blocks arriving in the near future, users will continue to find new opportunities to calibrate our website intelligence to their exact business requirements.
About TWIPLA.
TWIPLA is a complete website intelligence solution, underpinned by advanced cookieless tracking technology that enables businesses to collect data in compliance with all global laws. Our mission is to empower our community of 2.5 million users with the guidance they need for online success while keeping their website visitors safe. And with a commitment to cutting-edge innovation and data minimization, we're your trusted partner in the fast-paced world of analytics.
For media inquiries, please contact:
Simon Coulthard
Content Marketing Specialist