
- Frequently Asked Questions

- All About Features
- How to Install the Tracking Code
- User Guides
- Integrating With Other Platforms
- Legal, Data Privacy & Certificates
- White Label Analytics
- Glossary
- Affiliate Program
- Contact
Pages Feature
3 Sections Giving You Deeper Insight About the Use of Your Website's Pages
What It's All About

Within the Pages feature of the Web Statistics module, you have 3 sections that deliver you almost all the data you need about your website's pages:
Set the Time

Right above the tiles, you can see a date picker. This enables you to select a certain time period, or specific day, for which you want the Dashboard's data to correspond.
It is crucial to limit the presentation of data to specific dates or timeframes during which you executed potential campaigns or implemented other strategies. This will allow you to assess the effectiveness of these actions and use the insights gained for future planning.
Landing Pages

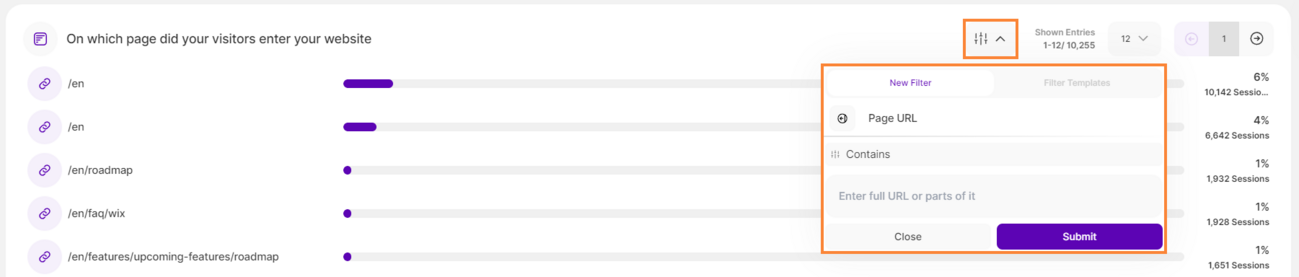
This graph provides you with an overview of where your website's visitors started browsing on your website. Each bar represents a page within your website. The names are automatically generated based on the corresponding page title. This table helps you to understand in depth which pages are seen first by your visitors.
The horizontal x-axis shows the number of sessions per page. The scale of the axis is always generated automatically. The percentage shown next to each bar indicates the proportion of total website sessions attributed to that particular landing page. This helps you understand the relative contribution of each page to your overall web traffic.
Important Hints:
- At the upper right corner of this interface, you will find the filter icon. You can use it to filter the data based on the Page URL. You have the option to enter either the full URL or parts of it.
- Additionally, you'll find information on the number of displayed entriescompared to the total number of entries.
- Pagination is also provided for seamless navigation through pages.
Conversion Pages

In this section you are being given a list of pages, which you have self-defined as "conversion pages" within your settings. The definition of a conversion can be found here. Each bar represents a conversion page within your website. The names are generated automatically from the corresponding page title.
A "conversion page" is a page within your website that you consider important for the success of your website (page implying that a payment has been done, reaching a specific document uploaded, etc.).
The horizontal x-axis shows the number of visits per page. The scale of the axis is always generated automatically. The percentage shown next to each bar indicates the proportion of total website sessions attributed to that particular conversion page. This helps you understand the relative contribution of each page to your overall web traffic.
Important Hints:
- In the upper right corner of this interface, you'll find information on the number of displayed entriescompared to the total number of entries. Pagination is also provided for seamless navigation through pages.
- If you want to edit your conversion pages, you can go to Website Settings > Special Pages > Conversion Pages. Note that you have to be an Administrator (Owner or Editor) for this website to make the changes. Check the rights of each role here.
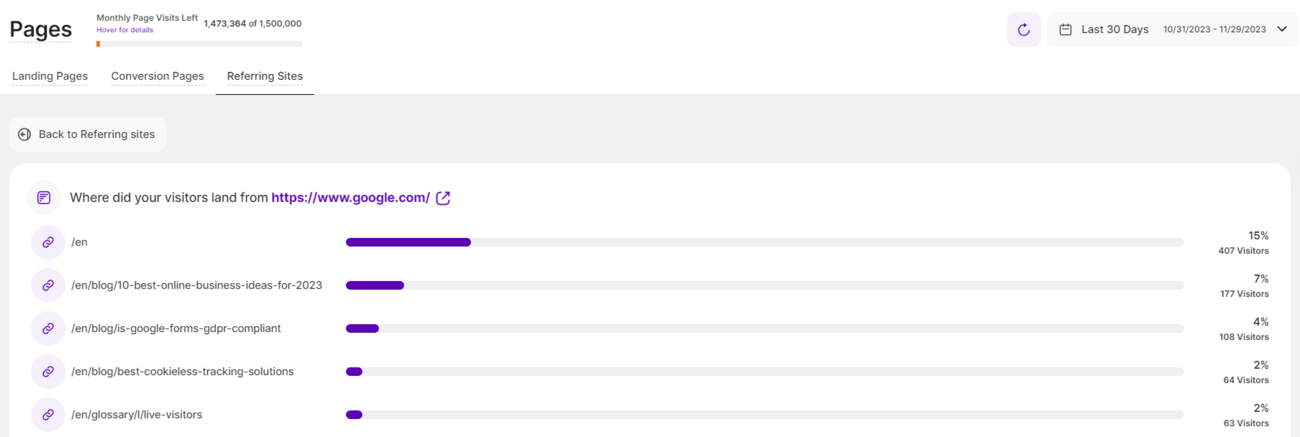
Referring Sites

In this section, you will gain a comprehensive understanding of the sources that drive traffic and visitors to your website through third-party websites or URLs.
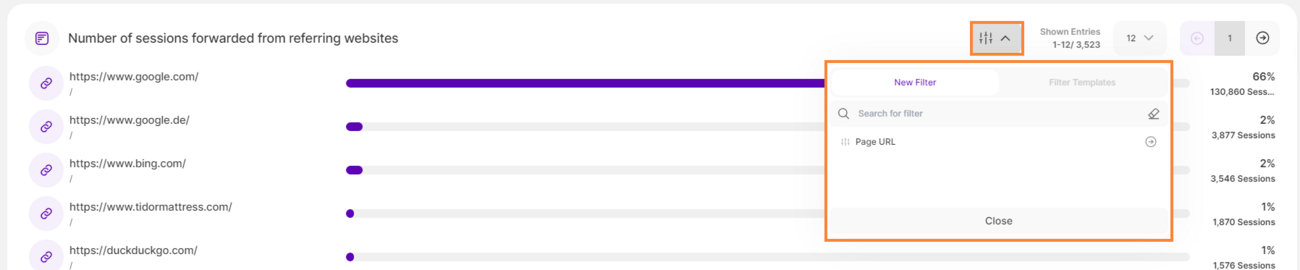
Each bar on the graph represents a distinct third-party website, with the "main URL" serving as the identifier for these referring sources. The percentage shown next to each bar indicates the proportion of total website sessions attributed to that particular website. This helps you understand the relative contribution of each website to your overall web traffic.
This data holds significant importance as it unveils the true origins of your website's visitors, shedding light on which external platforms are actively recommending your site with direct hyperlinks. These insights can be harnessed to delve deeper into the analysis of your user demographic, their content preferences, and areas of interest. Such information can be pivotal for refining your content strategy and tailoring it to suit the preferences and interests of your audience.
The horizontal x-axis shows the number of visits per page. The scale of the axis is always generated automatically.
Important Hints:
- When you click the referrer link, you will be taken to another page that displays a list of pages where visitors landed coming from each referring site.
- Visitors typing your website's URL directly into their browser bar, will NOT be counted among "referred traffic".
- At the upper right corner of this interface, you will find the filter icon. You can use it to filter the data based on the Page URL. You have the option to enter either the full URL or parts of it.
- Additionally, you'll find information on the number of displayed entriescompared to the total number of entries. Pagination is also provided for seamless navigation through pages.