
- Frequently Asked Questions

- All About Features
- How to Install the Tracking Code
- User Guides
- Integrating With Other Platforms
- Legal, Data Privacy & Certificates
- White Label Analytics
- Glossary
- Affiliate Program
- Contact
How to Get Started
Feature Guide for Analytics Users.
Learn How to Get the Analytics Toolkit Up and Running.
About this Guide.

This guide explains how new users can get the analytics toolkit up and running and customized to their preferences. It also provides basic instructions for using all the different features, as well as how to amend important account, subscription, and billing information.
The guide doesn't include detailed descriptions or instructions. If you need this information then please refer to the Support Center. And if you're looking for advanced advice for getting the most out of the analytics platform, refer to our ever-growing collection of User Guides.
Inside this Guide.
- Opening an Account.
- Setting the Language.
- Adjusting the Start Day of the Week.
- Changing Notification Preferences.
- Changing the Time Zone.
- Disabling Tracking for Your Own Visits.
- Adding, Removing, or Editing Contributor Access.
- Retrieving the Tracking Code.
- Adding an Additional Website.
- Integrating Another Domain into Website Analysis.
- Removing a Website from Your Account.
- Resetting Website Data.
- Importing Google Analytics Data.
- Exporting Analytics Data.
- Changing the Data Privacy Mode.
- Customizing Data Collection by Country.
- Setting the Time Period for Data You Want to See.
- Comparing Data with a Previous Period.
- Activating a Data Filter.
- Creating a Filter Template.
- Creating a Visitor Segment.
- Creating a Custom Dashboard.
- Creating a UTM Campaign.
- Creating a Heatmap.
- Building a Conversion Funnel.
- Defining Which Visitor Sessions to Record.
- Watching a Session Recording.
- Calibrating Auto-Tracked Default Events.
- Creating a Manual Event.
- Creating a Poll.
- Creating a Survey.
- Updating Billing Information.
- Verifying Your Current Payment Plan.
- Changing Payment Plan or Subscription Package.
- Choosing the Right Subscription Package.
- Finding Your Legal Documents.
Opening an Account.

Once you know which package is right for you, you're ready to open an account (though you can upgrade or downgrade at any point in the future). This begins the onboarding process that will get the toolkit firing on all cylinders. The signup process is broken down into two steps; the first adapts onboarding to your website's technical environment, while the second includes package selection, email verification, website URL input, privacy calibration, notification preferences, and tracking code installation. More information on integrating with other platforms can be found in the Support Center.
Step 1 of 2: Choose Your Technical Environment.
(Completed by All New Users).
Wix Users
Native Plugin
Wix users should select this option. This will open up the location of the analytics plugin in the Wix App Market in a new browser window.
And once you've downloaded it, you'll continue the onboarding process there.
Learn More About Integrating With Wix
Weebly Users
Native Plugin
Weebly users should select this option. This will open up the location of the analytics plugin in the Weebly App Center in a new browser window.
And once you've downloaded it, you'll continue the onboarding process there.
Learn More About Integrating With Weebly
I Don't Use Any of These Platforms
(Standalone)
Standalone website users should choose this option. This will bring them straight to the second signup step in the same browser window, where they'll get guidance on manually installing the app.
Learn More About Manual Integration
Step 2 of 2: Create Your Account.
(Completed by Standalone/HTML Website Users).

Set Account Credentials
Input the email address and password that you'd like to use to access the account. You can use the copy feature to save the password for your records.
Enter Any Voucher Discount Code
Input any promotional voucher code that you have received, and which will give you a discount or account access to additional functionalities.
Set Subscription Preferences
Confirm that you've read the Terms of Use and Data Protection Agreement, and decide whether you want to be emailed analytics and platform news.
Verify Your Email Address.
Once you've completed the above steps and created your account, we'll send an email verification. This acts to confirm that the address was inputted correctly, adds an extra layer of account security, and helps to prevent unauthorized access. It's also a requirement under data privacy laws like GDPR, and ensures that you'll be able to access the account in the future if you lose your login details for any reason.
Note: If this email doesn't reach your inbox, refresh the page and wait a minute. Also check your spam folder; if it's there, mark it "not spam" to ensure that you receive any future emails that you have subscribed to in notification preferences. Alternatively, contact Customer Support.
Input Your Website URL.
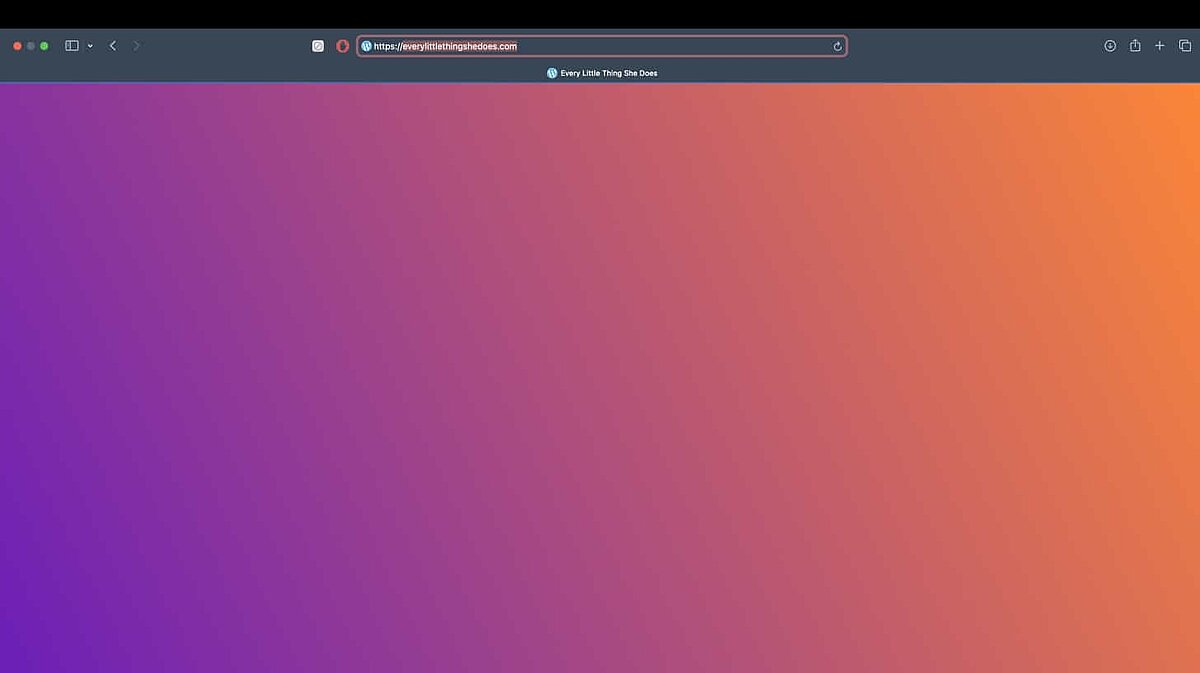
You'll now be asked to insert the website URL that you want integrated with the toolkit. We advise that you copy the homepage address from your browser's navigation bar to avoid any errors, selecting the domain name onwards. This means omitting "http://", "https://", and "www.", and selecting - for example - only "test.com" or "app.test.com".
Note: You can add as many more websites as you want to the account once these onboarding steps are complete. Do this by clicking on your website's name in-platform at the very top left corner of your screen, selecting Add New Website, and following the instructions provided.
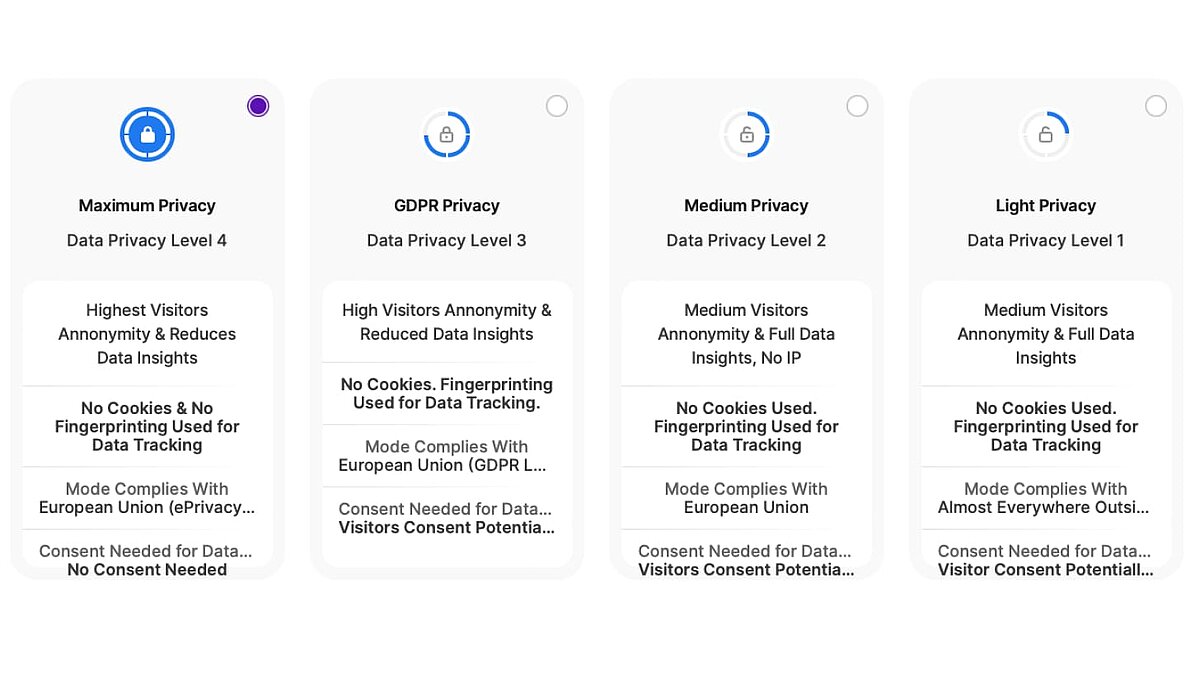
Choose a Data Privacy Mode.
You'll now be asked to select the platform-wide privacy mode from four options. Choose Maximum Privacy Mode and meet all global requirements without any additional legal responsibilities. Alternatively, choose a lower privacy mode, adopt the necessary compliance measures, and legitimately collect deeper visitor-by-visitor datasets.
Note: The privacy modes have been named to make it easy to identify the compliance thresholds met by each. You can set a different mode for each country of origin to maximize data capture within the limits set by laws local to website visitors, and can do this in the Privacy Center.
Set Your Notification Preferences.
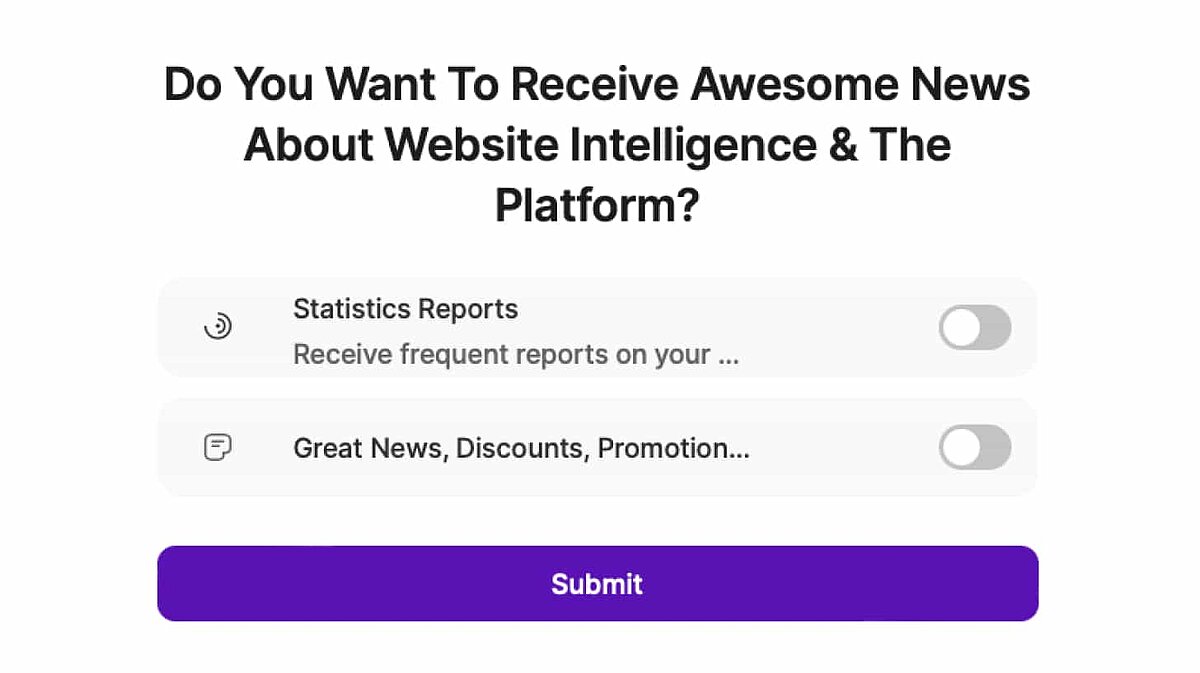
This onboarding step allows you to decide which email notifications to receive from the analytics platform and provider, and provides the opt-in consent we need for email contact. While optional, regularly-emailed Statistics Reports are an invaluable website intelligence aid for many of our users. You can turn these emails off here, or limit their frequency.
Use this opportunity to also control subscriptions to our marketing and promotional messages, as well as the monthly newsletter. This serves as a summary of new features, platform updates, and data privacy news, and it also has information on any promotions that we're running.
Install the Tracking Code.
You now need to install the generated JavaScript snippet into website source code. Help is provided with Support Center links to tracking code installation guides for the most popular website building routes, including Wordpress, Google Tag Manager, Wix, Weebly, and TYPO3.
Standalone website owners need to manually install the tracking code. This means pasting it correctly into webpage source codes or template files. And if you have any issues installing the snippet or populating the analytics toolkit with data, don't hesitate to contact Customer Support.
Note: If non-Wix users need the tracking code again for any reason, they can find it in the Manage Account Website(s) section of Account Settings. The tracking code is also available in the Tracking Code section of Website Settings.
Setting the Language.
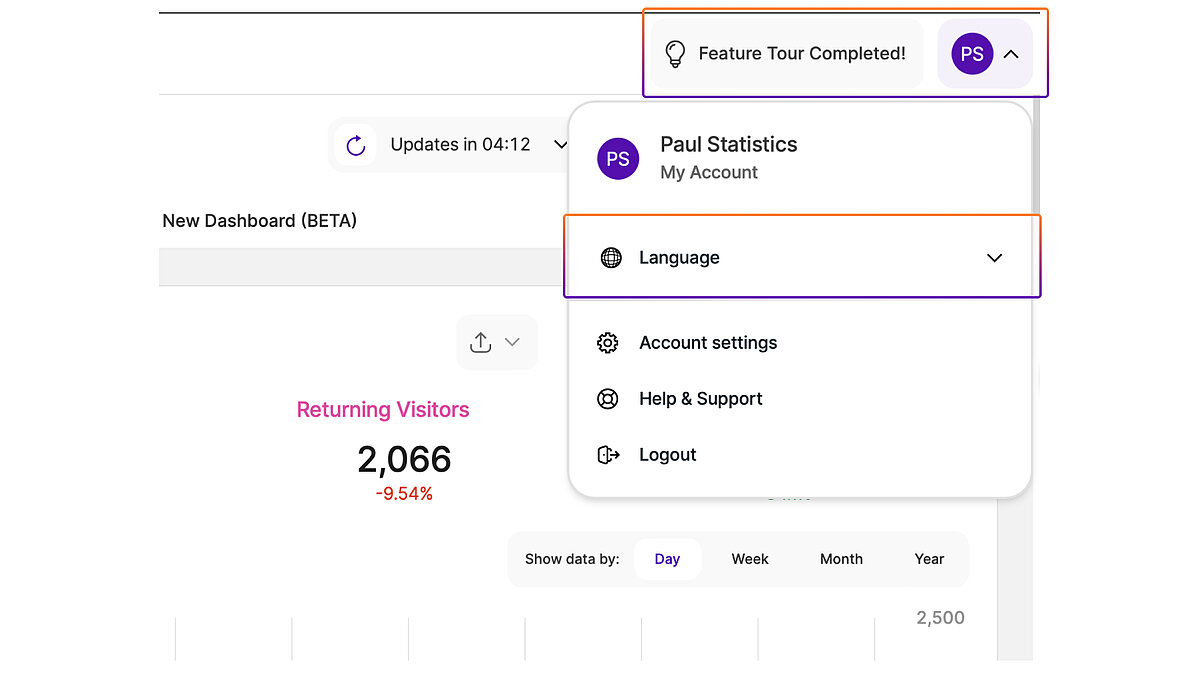
The website intelligence toolkit is set to English by default, but can be quickly set to another language. And while we're regularly working to translate the platform into more languages, it is currently only available in the most-spoken European languages. These are French, German, Italian, Portuguese, Romanian, and Spanish.
To change the language, open the Dropdown Language Selector at the very top-right-hand corner of your screen in-app and select the desired language option from the list. The language will then change immediately throught the platform and without any to need to reboot or refresh. This process can also be repeated as often as required.
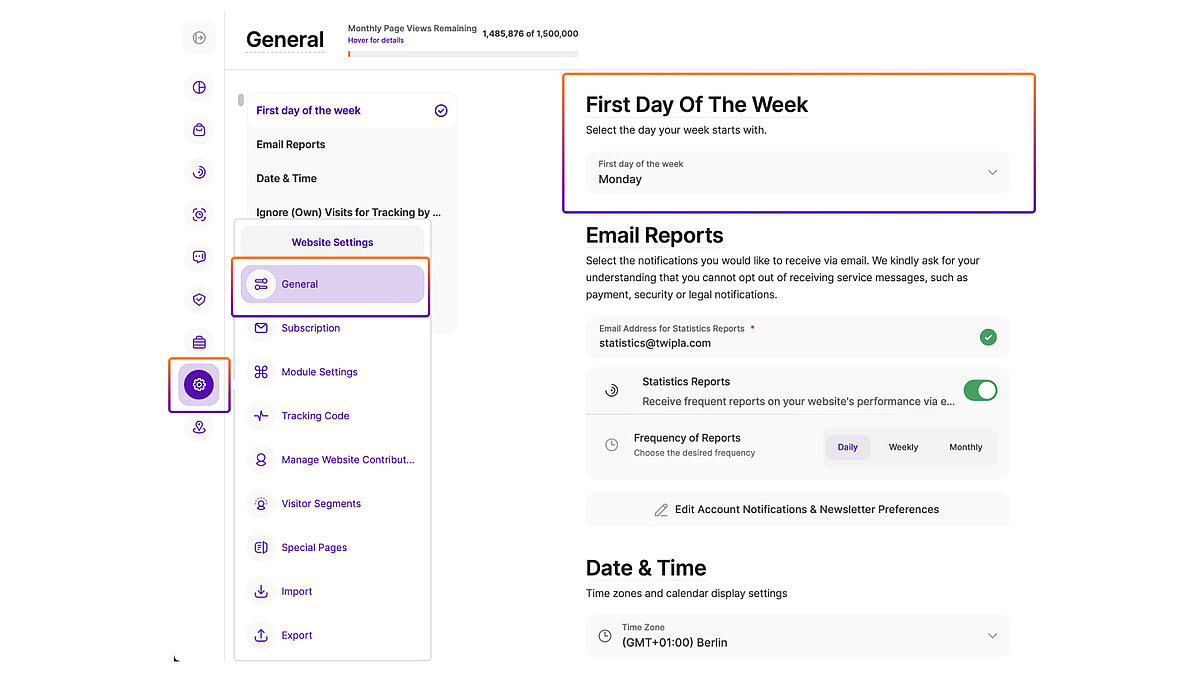
Adjusting the Start Day of the Week.
Adjusting the start day of the week is important for businesses with fiscal weeks that begin on a day other than Monday, and those that don't share the Western weekend. This can be done as follows:
- Go to Website Settings in the vertical left-hand icon menu and click on General.
- Select the weekday you want the week to start on from the dropdown menu.
Hint: Check that the toolkit's start week day matches your business. This ensured that the analytics data will align with internal reporting structures, facilitating more accurate analysis and decision-making.
Changing Notification Preferences.
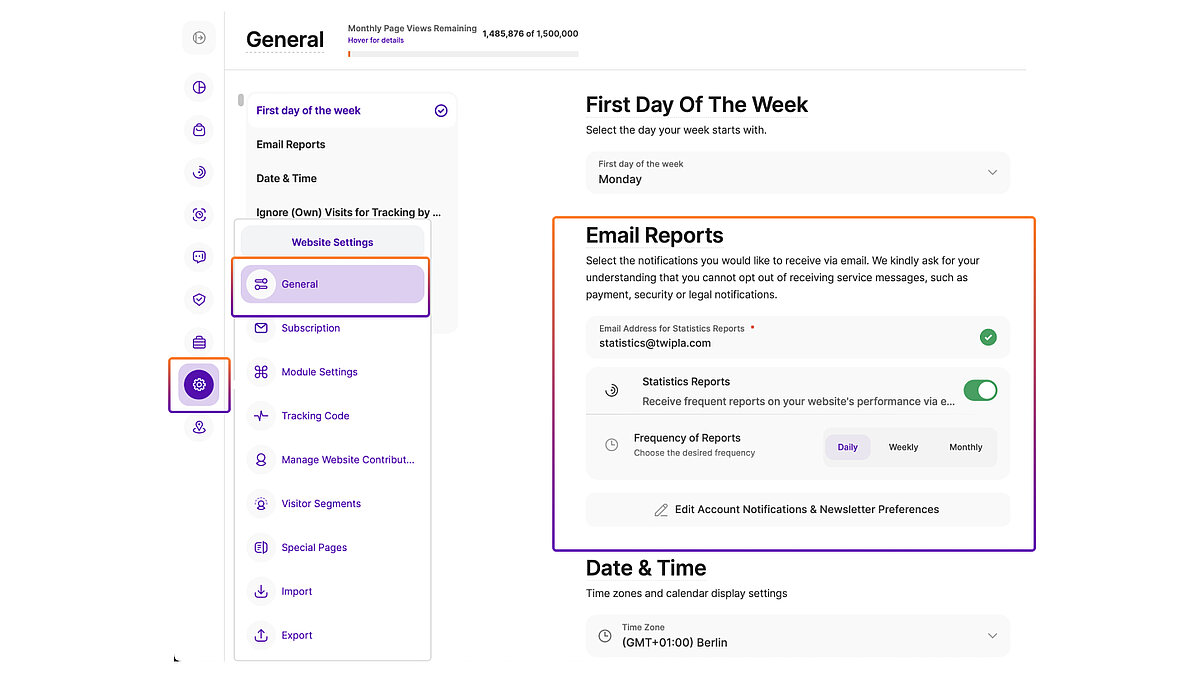
While you will have recently set notification preferences during the onboarding process, you can change them at any time. Notification preferences are divided into those for the emailed Statistics Reports, and those for the wider account. They can be amended as follows:
Email Report Preferences.
- Go to Website Settings in the left-hand vertical icon menu and click on General.
- Update the email address that statistics reports are sent to.
- Set whether reports are sent daily, weekly, or monthly.
Account Notifications.
- Open the dropdown with your account initials at the top-right corner of your screen and click into Account Settings.
- Toggle on or off newsletter and promotional marketing authorization.
Hint: We keep marketing messages to a minimum and what we send informs analytics success. But we also regularly offer discounts for higher subscription plans. If you want to receive these voucher codes, enable promotional marketing authorization in Account Settings.
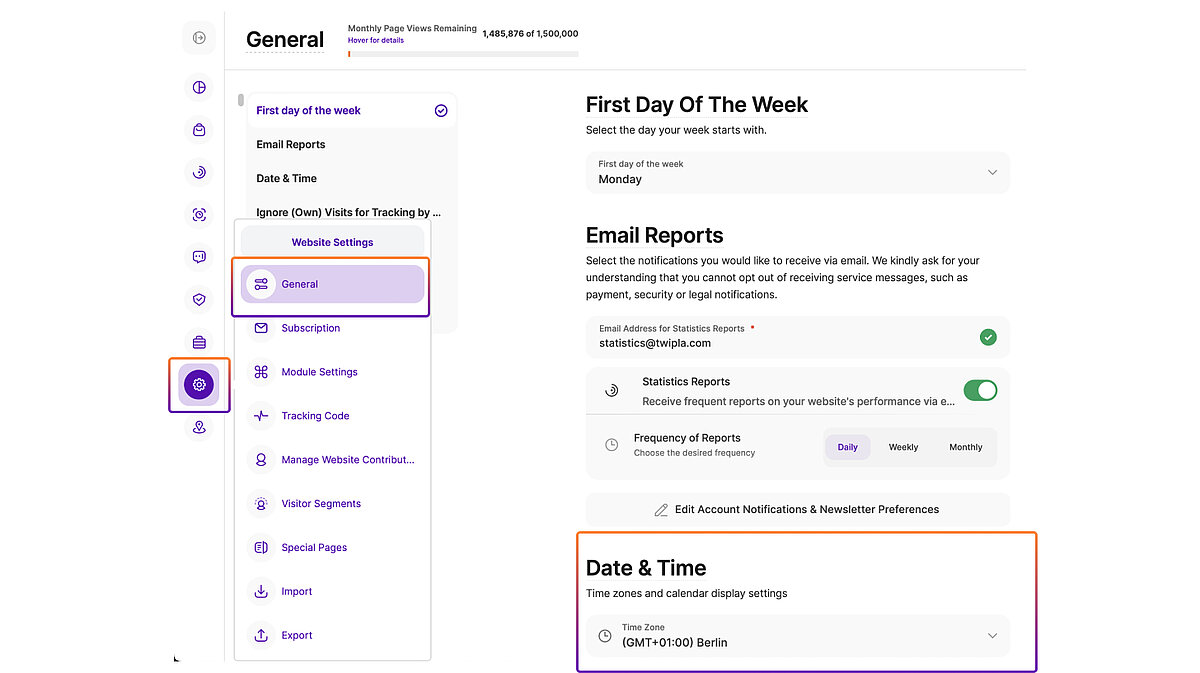
Changing the Time Zone.
Changing the time zone is an easy way to ensure that reports align with the time zone local to you or relevant to business operations:
- Go to Website Settings in the vertical left-hand icon menu and click on General.
- Select the time zone from the dropdown menu.
Hint: Aligning the time zone with your business streamlines data analysis, especially when dealing with international audiences or when comparing data across different regions with distinct time zones.
Disabling Tracking for Your Own Visits.
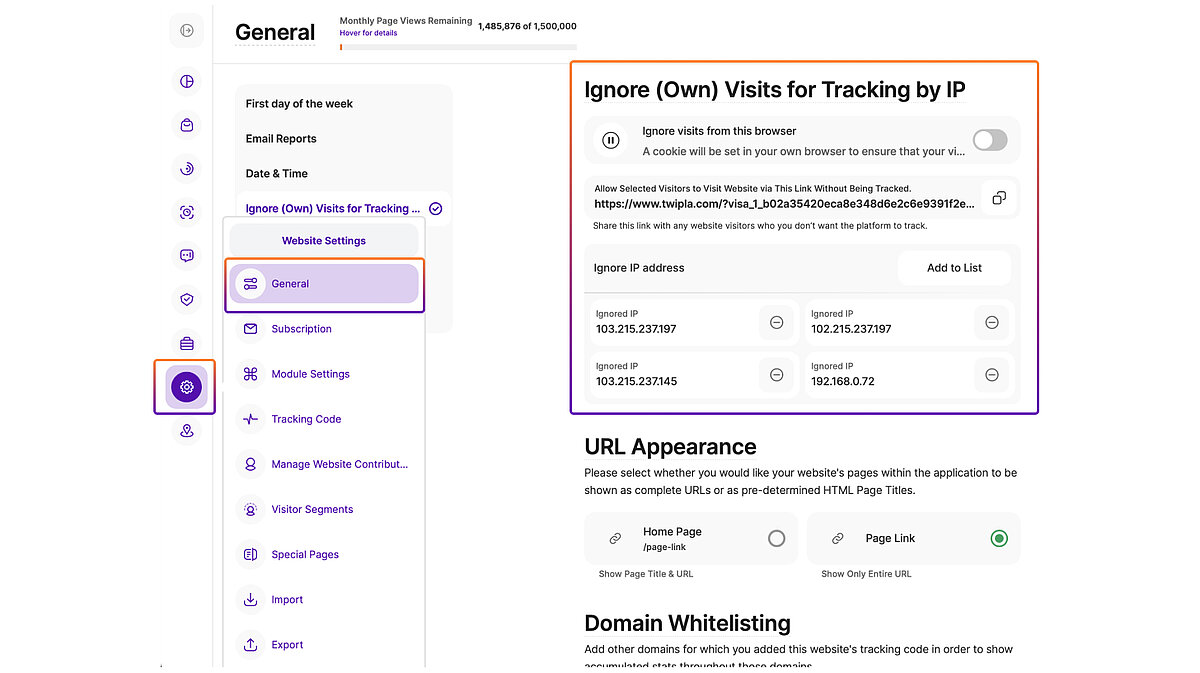
If you regularly visit webpages, then your data will skew performance reports. To disable tracking for your site visits, follow these steps:
- Go to Website Settings in the vertical left-hand icon menu and click on General.
- Toggle on Ignore Visits from this Browser.
Note: The platform sets a browser cookie to identify and exclude your website visits from reports, meaning you will have to re-add it to the account after clearing the browser cookie cache. If you use multiple browsers, you'll need to repeat this process through each one.
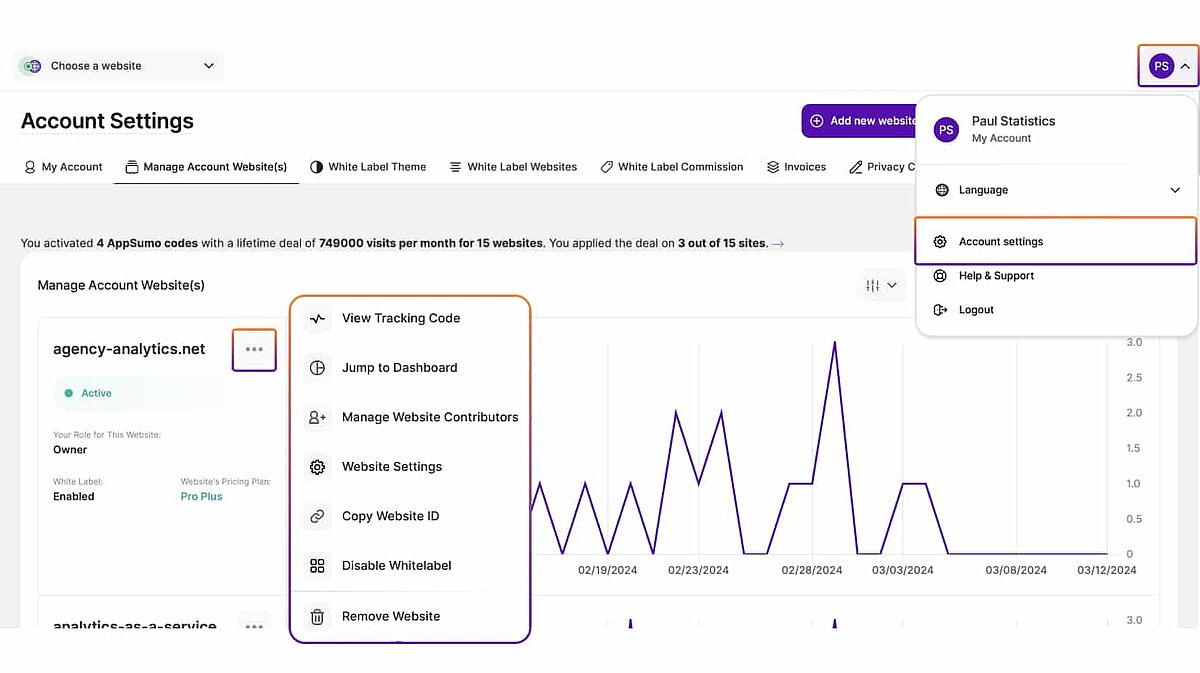
Adding, Removing, or Editing Contributor Access.
Providing others with access to analytics can streamline processes and increase data utility. Manage access by following these steps:
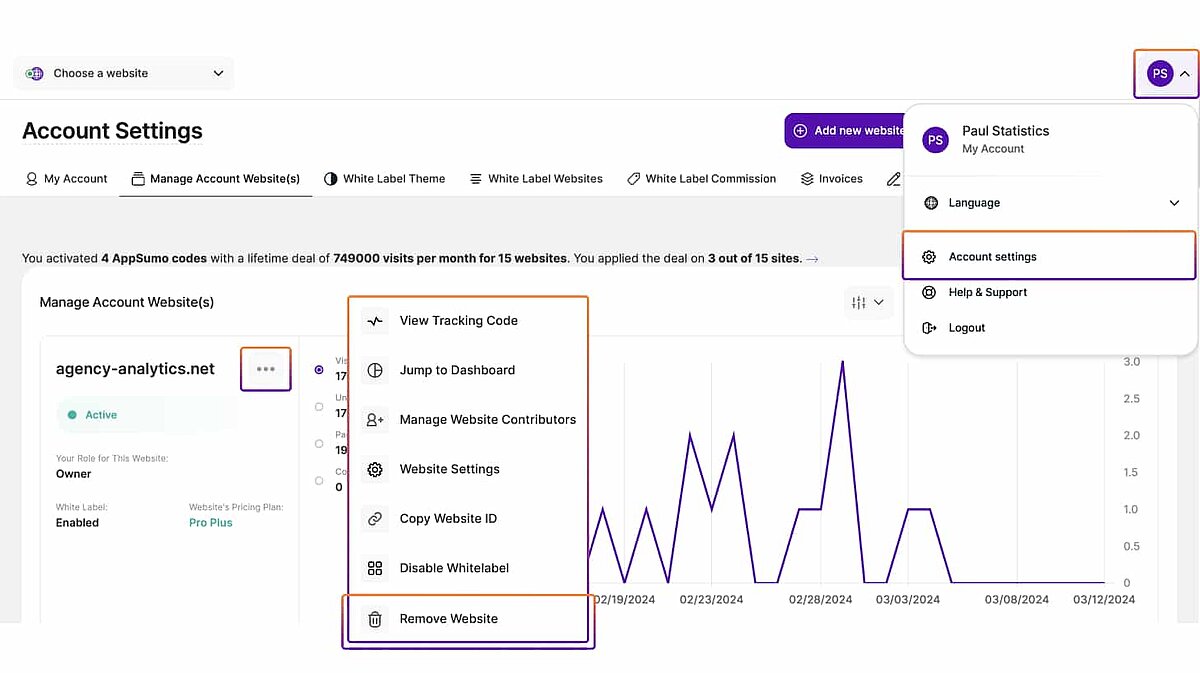
- Open the dropdown with your account initials at the top-right corner of your screen, click into Account Settings.
- Go to Manage Account Website(s).
- Click on the three-dot meatballs menu dropbown to the right of the relevant website name, and select Manage Website Contributors.
- Add a new contributor by inputting their email address and role, and then click Invite Contributor. Pending invites will also be shown here.
- Edit the access level of existing contributors by clicking on the dropdown Role menu.
- Remove an existing contributor by clicking on the ∅ button, and authorize removal by entering the account password.
Note: Controlling analytics access is important for managing data and meeting privacy compliance requirements. Edit contibutor access to protect sensitive data, prevent unauthorized changes or misuse of anaytics, and improve collaboration among coworkers and others.
Retrieving the Tracking Code.
Depending on your website's technical environment, you might not need to approach the tracking code after installation. Others will need to retrieve it regularly, and they can find it by following these steps:
- Go to Website Settings in the left-hand vertical icon menu and click on Tracking Code.
- Click Copy Snippet to Clipboard to copy the tracking code.
Note: The tracking code is different for every new website you add to the account, of which there is no restriction. If you need the JavaScript snippet for a new website, follow the steps in the section that follows.
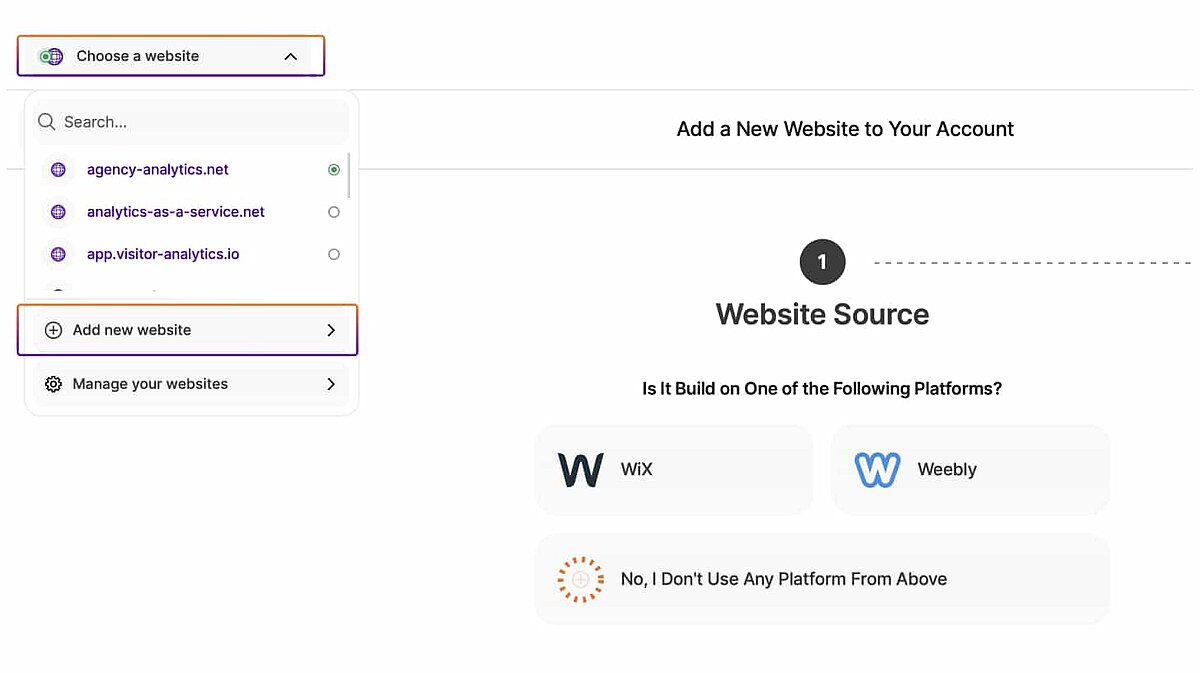
Adding an Additional Website.
To add another website to the platform for analysis, follow these steps:
- Click on the website selector at the very top left of your screen and select Add New Website.
- This will initiate the onboarding process for a new website, and will ask you to input the website URL, choose the data privacy mode, and provide the tracking code.
Hint: The platform will analyze websites separately, and you can toggle between website reports by clicking on the website selector at the very top left of your screen. If you want accumulated stats on multiple websites or domains, you can learn how in the section that follows.
Integrating Another Domain into Website Analysis.
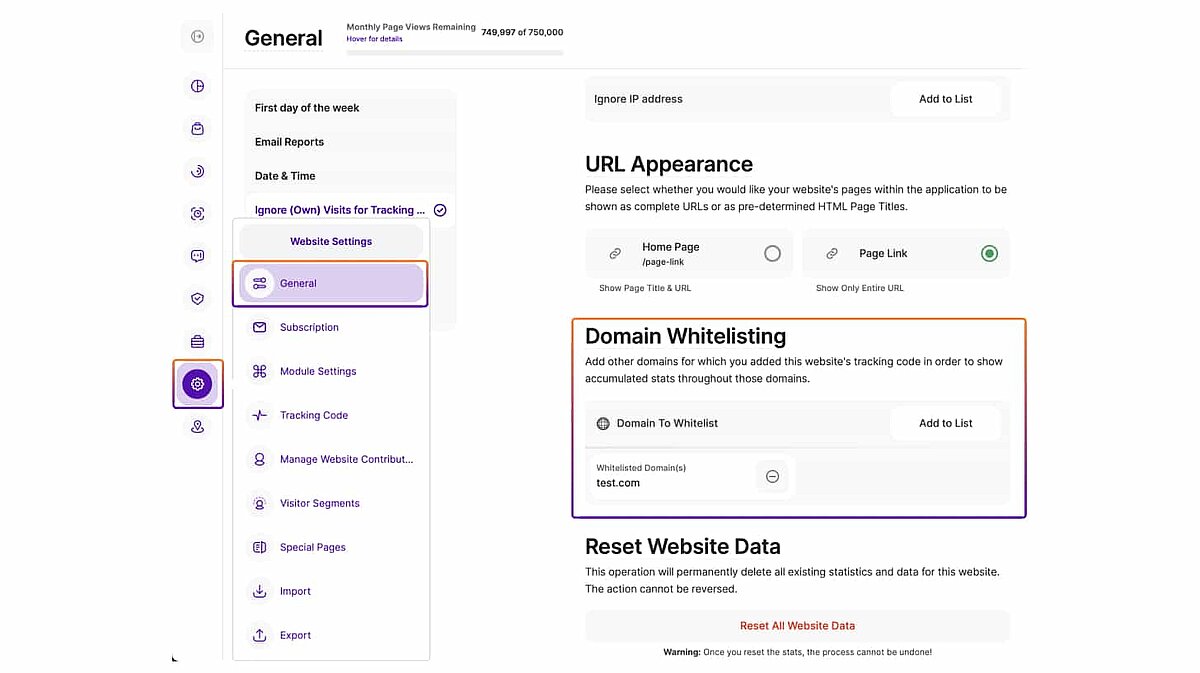
If you want to adapt the website intelligence toolkit to analyze the accumulated data from two or more domains, follow the steps below:
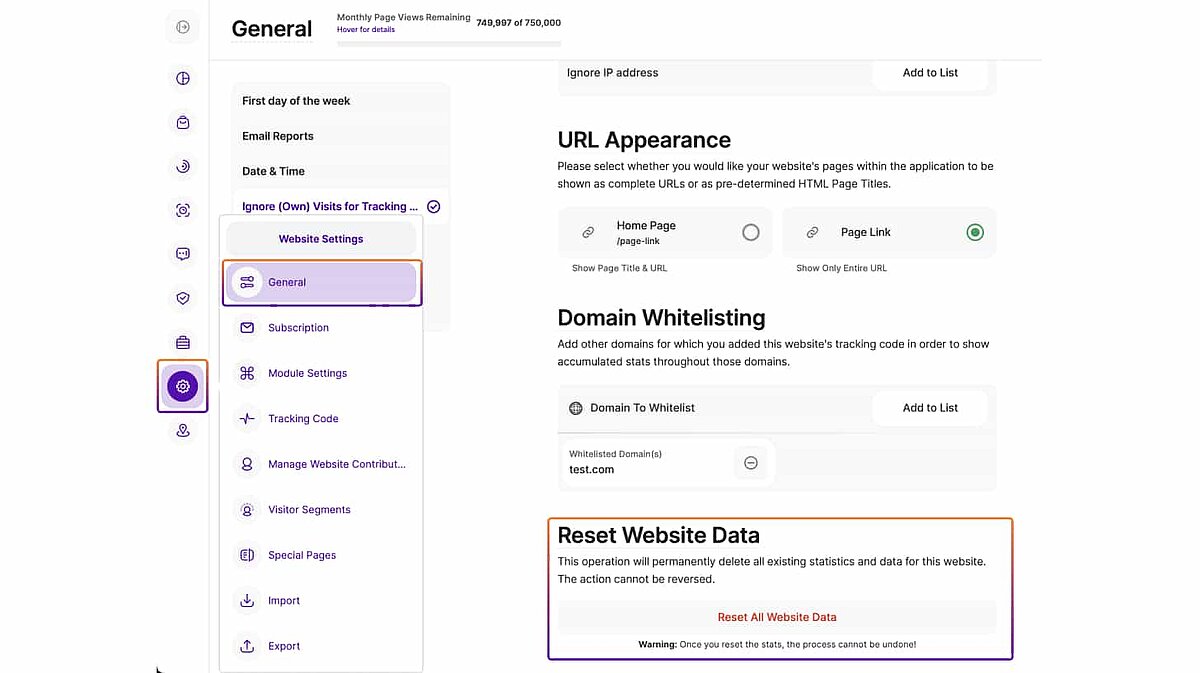
- Go to Website Settings in the vertical left-hand icon menu and click on General.
- In Domain Whitelisting, paste in the secondary domain URL. Click Add to List.
Hint: This domain whitelisting is a great way to consolidate data from related websites, and to gain a far more comprehensive understanding of visitor behavior than can be achieved when the sites aren't linked.
Removing a Website from Your Account.
To remove a website from your analytics account, follow these steps:
- Open the dropdown with your account initials at the top-right corner of your screen and click into Account Settings.
- Go to Manage Account Website(s).
- Click on the three-dot meatballs menu dropbown to the right of the relevant website name, and select Remove Website.
- Enter the account password to authorize website removal.
Note: Deleting a website will stop tracking and cancel your subscription. It will also permanently delete all existing data for this website. To keep a record of this data, tick the checkbox to get the platform to export all historic data to the account email address.
Resetting Website Data.
Accounts with multiple websites will need to reset data for each one separately, but there are two in-app routes to performing this task:
Route 1.
- If you have integrated multiple websites into the account, ensure that the relevant one is selected in the dropdown menu at the very top-left of your screen.
- Go to Website Settings in the left-hand horizontal icon menu and click on General.
- Scroll to the bottom of this page and click Reset All Website Data.
Route 2.
- Open the dropdown with your account initials at the top-right corner of your screen, click into Account Settings.
- Select Manage Account Website(s).
- Click on the three-dot meatballs menu dropbown to the right of the relevant website name, and select Website Settings.
- Scroll to the bottom of this page and click Reset All Website Data.
Hint: Resetting site data can clear out anything inaccurate or outdated. It can be useful to start afresh with clean data for accurate analysis, or to address any data discrepancies or anomalies within the platform.
Importing Google Analytics Data.
If you want to import historic website data into the website intelligence toolkit from Google Analytics for any reason, follow these instructions:
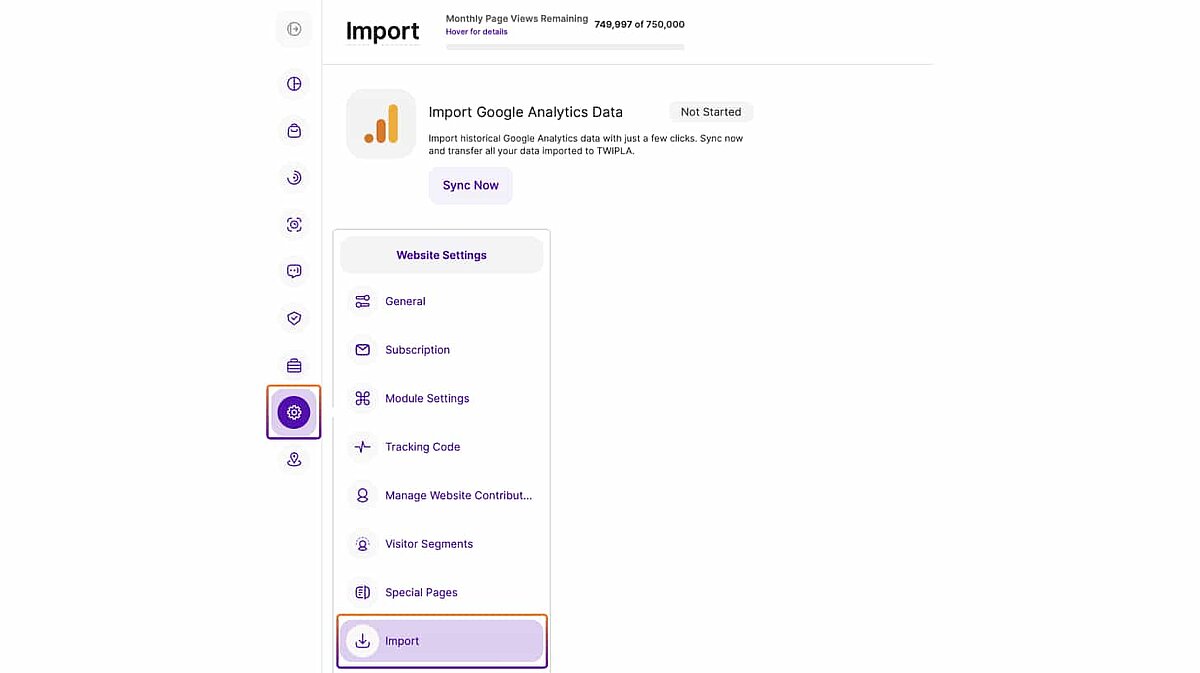
- Ensure the right website is selected in the Dropdown Website Selector at the very top left of your screen.
- Go to Website Settings in the vertical left-hand icon menu and click on Import.
- Click Sync Now in the Google Analytics data migration module.
Hint: More data means far better insight accuracy. Importing historic Google Analytics data will enable you to consolidate your data silos, enhancing reporting capabilities and comparative analysis.
Exporting Analytics Data.
This is a great feature for anyone who values data ownership and wants to conduct analysis outside of the website intelligence interface. If you want to export data, then please follow these instructions:
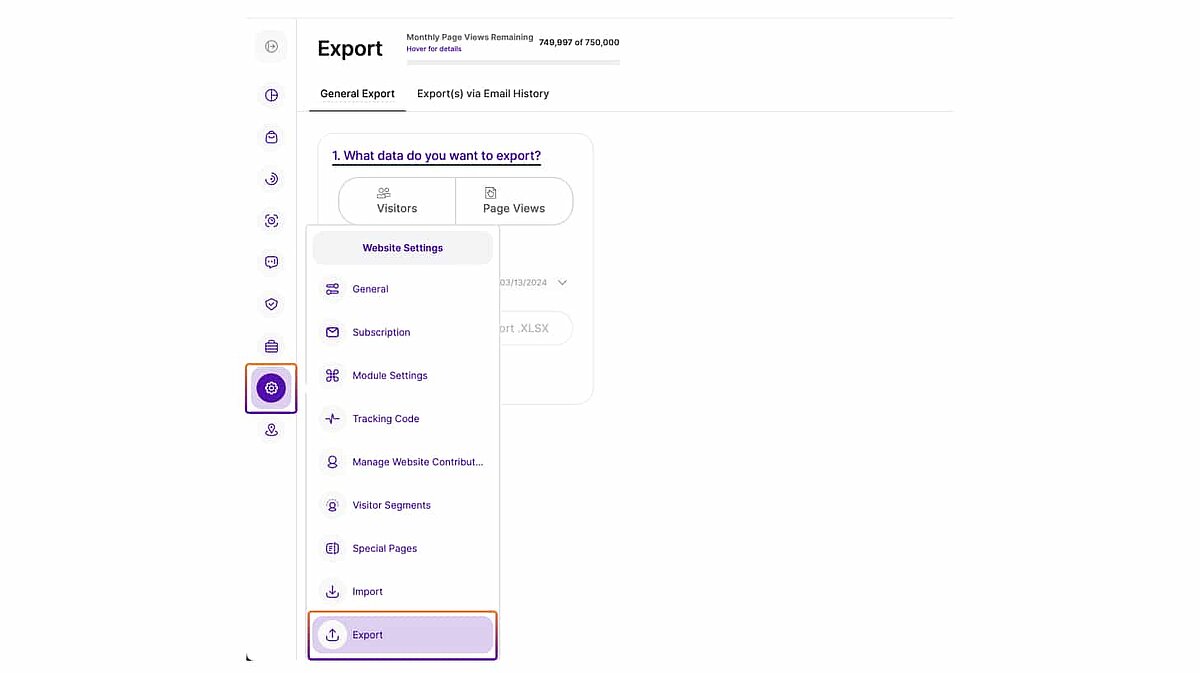
- Go to Website Settings in the vertical left-hand icon menu and click on Export.
- Select whether you want to export data on visitors or page views.
- Set the date range and data export format: .CSV or .XLSX.
- Click Export.
Export Management: Since large data exports take time to process, you'll receive an email notification when export requests are ready to download in zip form. You can also return to this interface, see a record of export requests, and redownload any previously requested files.
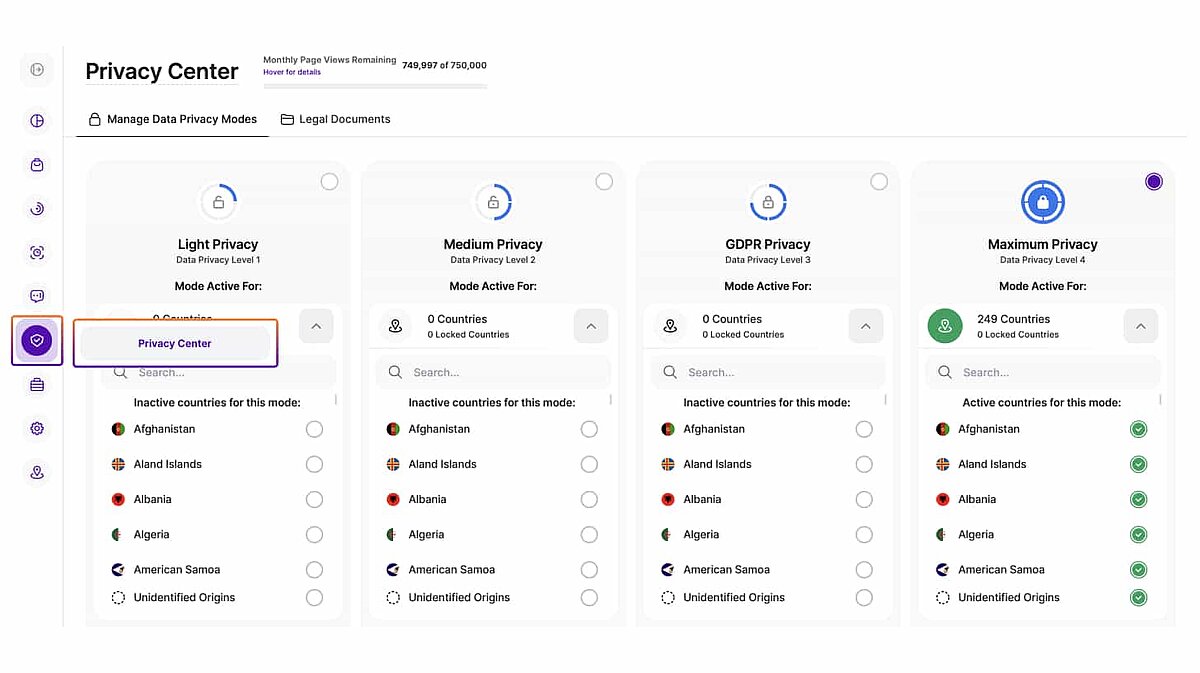
Changing the Data Privacy Mode.
To change the website intelligence platform's privacy mode (and depth of data collection) at any time, follow these instructions:
- Go to Privacy Center in the left-hand vertical icon menu.
- Click on the top of a privacy mode to set the platform default.
- Click save before leaving the module to not lose any changes.
Hint: Businesses can experience shifts in internal privacy policies and data handling practices, and laws change. This makes it essential to understand analytics data capture, and to return to the Privacy Center regularly to ensure that it is calibrated to business requirements.
Customizing Data Collection by Country.
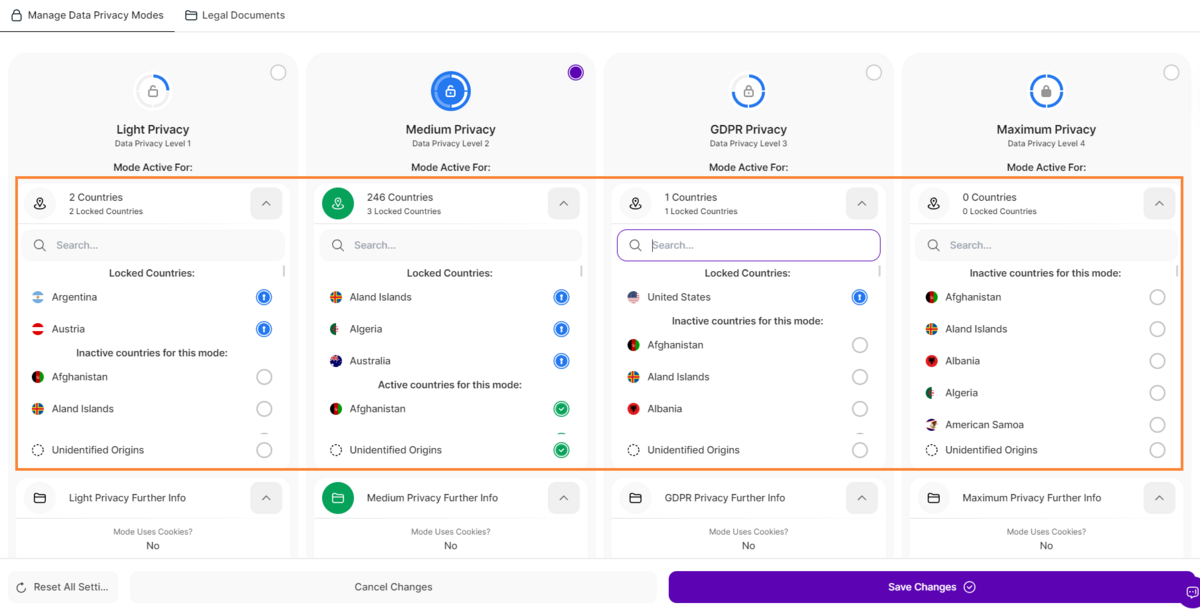
After onboarding, the website intelligence platform is calibrated to your chosen privacy mode. However, you can set a different mode for each country of visitor origin. This can be done by following the steps below:
- Go to Privacy Center in the left-hand vertical icon menu.
- Establish which privacy level you want for a specific country, and scroll down to this country in the relevant privacy mode list.
- Click on the country to activate the privacy mode for visitors from that country.
- If needed, click on the country a second time to remove it from this privacy mode, returning data collection to your chosen platform-wide privacy mode.
- Click save before leaving the module to not lose any changes.
Note: Fine-tuning global data capture to local data privacy laws is a great way to maximize legitimate data capture, particularly if your target market is located in some of the less-regulated regions.
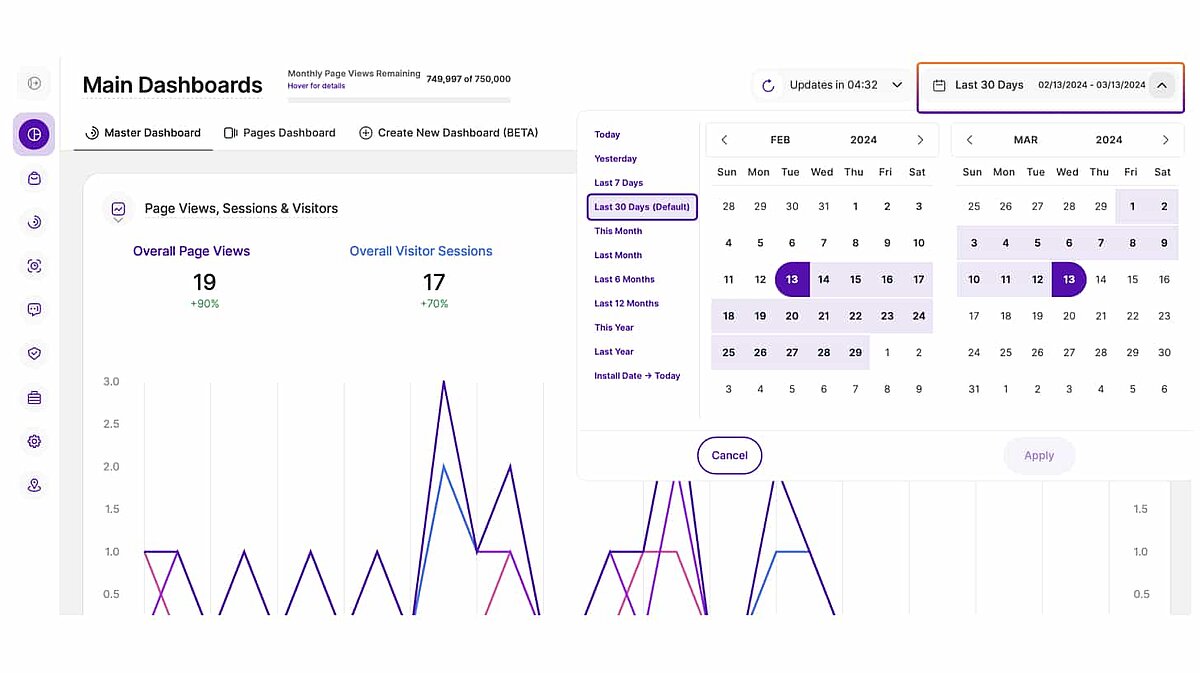
Setting the Time Period for Data You Want to See.
Changing the data display period is a vital first step for new users, and is useful across the toolkit. It can be achieved by following these steps:
- Click on the date range dropdown at the top right of your screen.
- Select a saved date range or input a custom range in the calendar.
- Click Apply.
Hint: Explore the different pre-set time intervals in the date range dropdown menu, and set a custom date range. This functionality will help you to segment data across the website intelligence platform.
Comparing Data with a Previous Period.
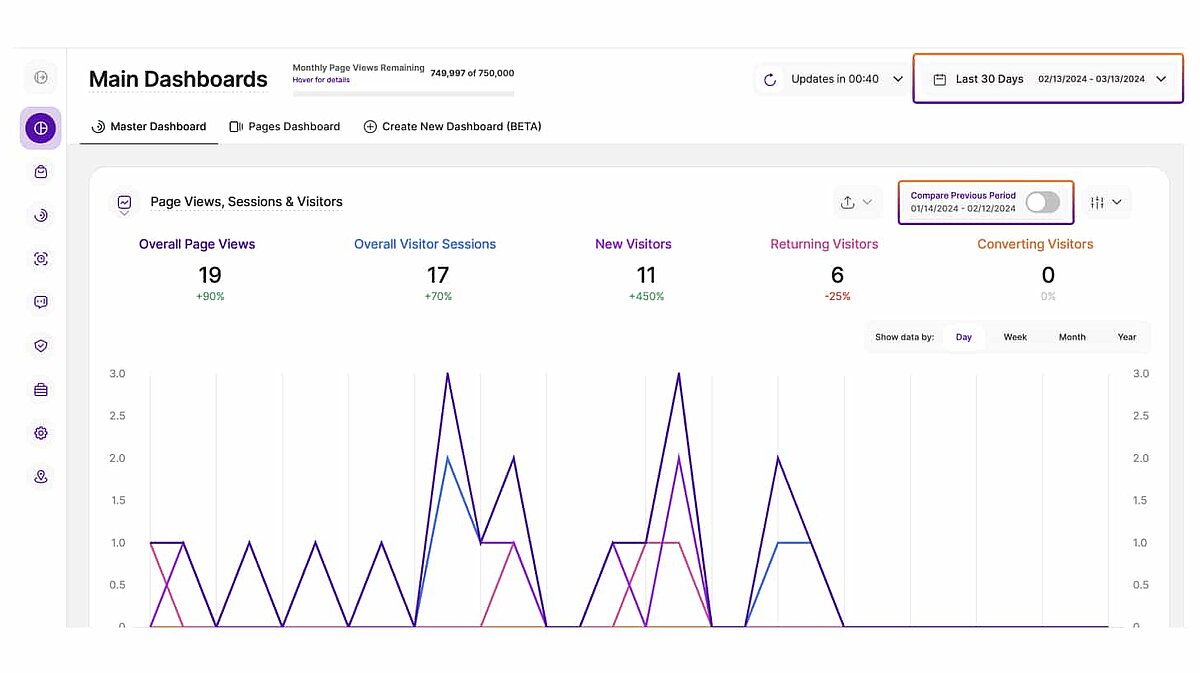
To compare current data with an earlier period, follow these steps:
- Click on the data range dropdown at the top right of your screen.
- Select a saved data range or input a custom range in the calendar.
- Click Apply.
- Toggle on Compare Previous Time Period.
Hint: Comparing data with a previous time period is a quick but useful way to track performance trends, identify changes in website visitor behavior, and evaluate the effectiveness of strategies over time. The platform does also have a Year-on-Year data comparison function.
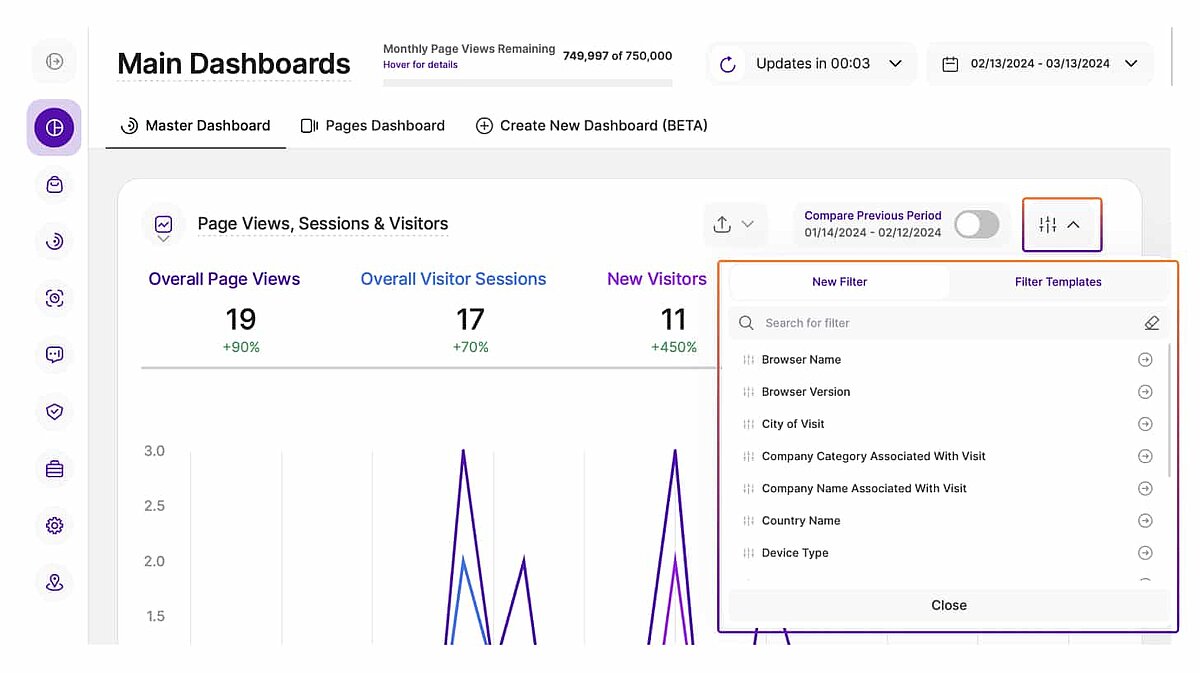
Activating a Data Filter.
To activate a data filter, follow these instructions:
- Click on the Apply Filtering dropdown at the top-right corner of any report block that has this functionality.
- Select one of the filters from the list and click submit.
- Repeat this process to add as many filters as you want.
Hint: The filtering options are comprehensive. We recommend that you build filter templates and visitor segments around the characteristics of your target audience. This will enable you to quickly calibrate the interfaces to your needs and speed up website intelligence research.
Creating a Filter Template.
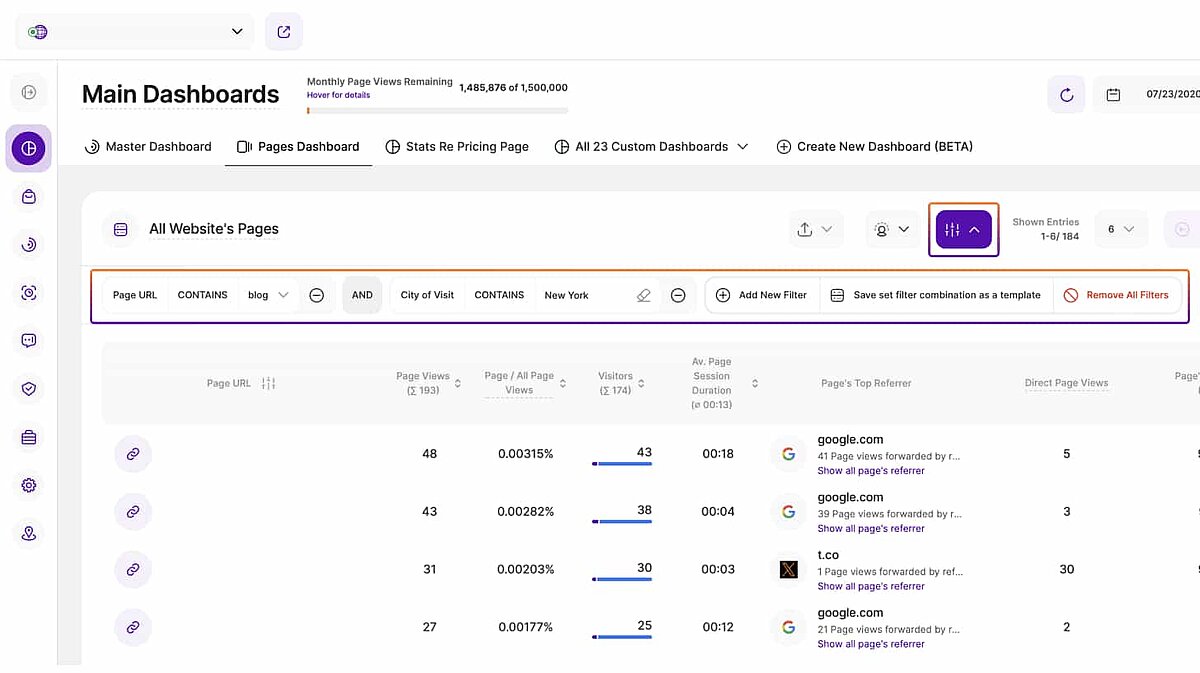
To create a multi-level filter template, follow these instructions:
- Click on the Apply Filtering dropdown.
- Select one of the filters from the list and click submit.
- Repeat this process to add as many filters as you want.
- Click Save Set Filter Combination as a Template.
- Name the filter template.
- Click Save Changes.
Hint: Once you've created some filter templates, you can activate them on any filterable report block across the toolkit -making them a useful tool for quickly calibrating website intelligence reports to your needs.
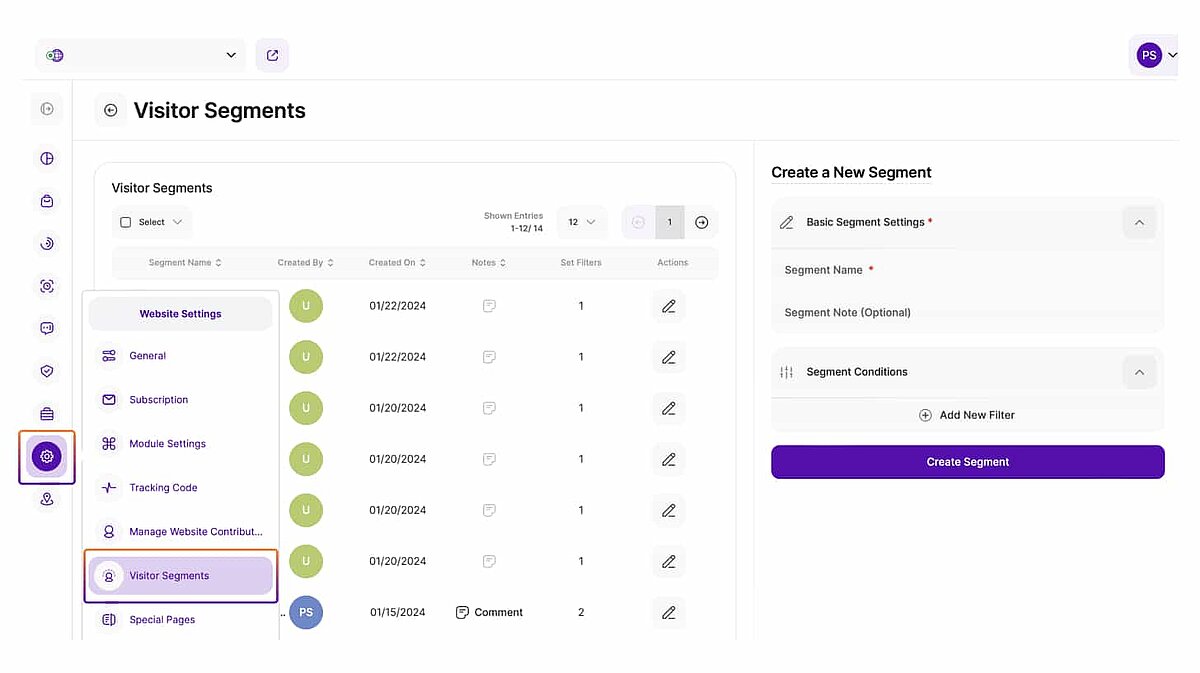
Creating a Visitor Segment.
To create a visitor segment, follow these instructions:
- Go to Website Settings in the vertical left-hand icon menu and click on Visitor Segments.
- Name the new visitor segment and add an optional note if desired.
- Add all the filters you require.
- Click Create Visitor Segment.
Hint: Visitor segments exist so that you can calibrate analytics reports to your target audience. Create one for each of the demographics that are most important for your business, and click on the icon at the top right of each report block that bares it to activate a visitor segment.
Creating a Custom Dashboard.
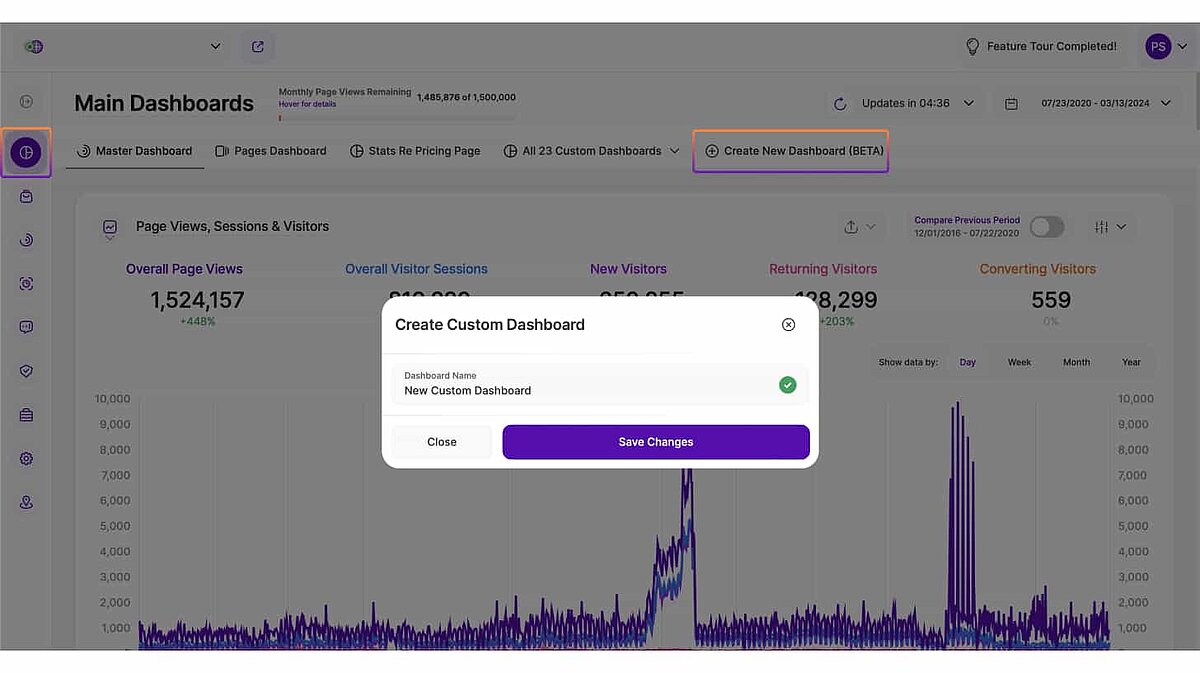
To create a custom dashboard, follow these instructions:
- Select Main Dashboards in the vertical left-hand icon menu.
- Click Create New Dashboard.
- Input a dashboard name for reference and click Save Changes.
- Click Add Report Block to Custom Dashboard and add as many report blocks as you want from the list.
- Click Edit Data Shown in Report to change the report block name and to activate filters or segments.
- Click Save Changes to save any work done to the custom dashboard.
Hint: Custom Dashboards are an invaluable tool that enables you to create custom reports using report blocks from across the analytics toolkit. Use this feature to create reports specific to any task, and use them whenever possible to speed up website intelligence work.
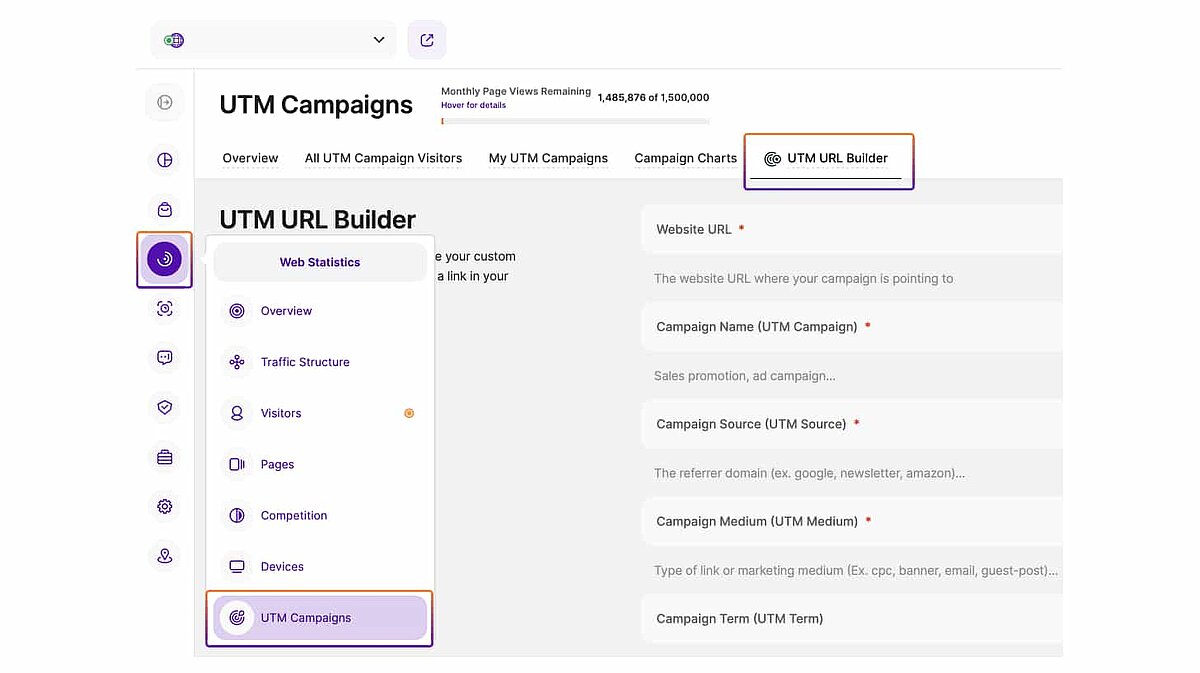
Creating a UTM Campaign.
To create a UTM campaign, you'll need to generate a custom UTM URL and insert it into any outreach that shares the same landing page, and is part of the same campaign. To do this, follow these instructions:
- Go to the Web Statistics icon in the vertical left-hand icon menu and click on UTM Campaigns.
- Open the UTM URL Builder and create the UTM code: paste in the campaign landing page URL, campaign name, source, medium, and any other information that will help you to identify the UTM campaign name.
- Click Copy to Clipboard to copy the generated UTM code, and use this as the landing page link in any marketing outreach within the campaign.
- Return to UTM Campaigns to analyze campaign performance.
Hint: Any site visitors that arrive through the generated UTM link will be analyzed within the same campaign. Try to adopt a standardized approach to the UTM campaign elements from bullet point two to ensure that you can quickly identify which UTM campaign it relates to.
Creating a Heatmap.
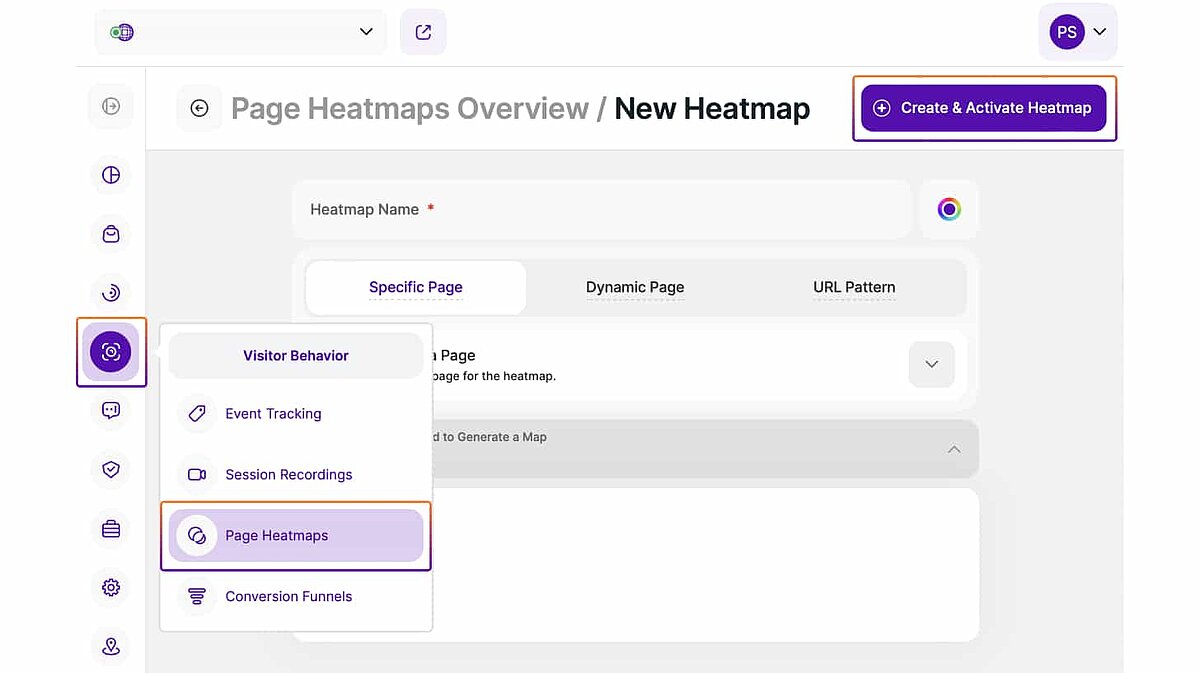
To create a heatmap, follow these instructions.
- Go to Visitor Behavior in the vertical left-hand icon menu and click on Page Heatmaps.
- Click on Create Heatmap in the top right corner of your screen.
- Set the heatmap name and optional color palette if desired.
- Choose whether you want to create a heatmap for a specific page, dynamic page, or URL pattern.
- Set the heatmap's page view limit.
- Wait for the heatmap to collect data up to the limit set, or return to Page Heatmaps to view the heatmap at any time.
Hint: The number of heatmaps you can generate depends on your package, but they're an invaluable guide to improving webpage layout and design. If you have a lower plan, use all your heatmaps each month to ensure you're not missing out on these intuitive insights.
Specific, Dynamic, or URL Pattern.
Choose the Right Heatmap for Deeper Insights:
Specific Page Heatmap
This heatmap type visualizes visitor interactions on a single webpage. They provide insights into engagement, and where visitors click, how far they scroll, or where their cursor hovers.
Dynamic Page Heatmap
These track behavior across multiple pages that share similar characteristics. They're useful for analyzing engagement patterns on pages with dynamic content, such as product listings or search results.
URL Pattern Heatmap
URL pattern heatmaps aggregate user interaction data based on common URL patterns or structures, helping users understand overarching trends in navigation and engagement.
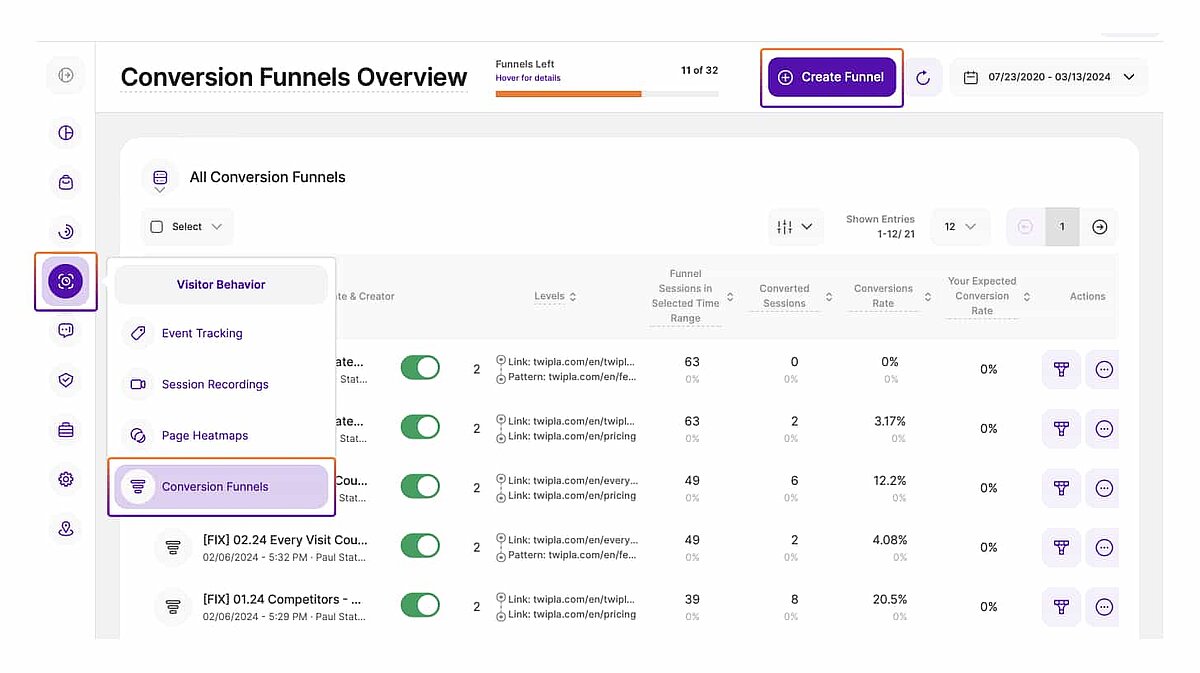
Building a Conversion Funnel.
To create a conversion or sales funnel, follow these instructions:
- Go to Visitor Behavior in the vertical left-hand icon menu and click on Conversion Funnels.
- Click on Create Funnel in the top right corner of your screen.
- Set the funnel name and (optional) expected conversion rate if desired.
- Click on the dropdown menu next to Funnel Level 1; then either select a page from the autogenerated list or paste in the webpage URL.
- Repeat this process to add as many webpages as you want (up to the limit of eight).
- Click on Create & Activate Funnel in the top right corner of your screen, or save it as a draft and continue building the funnel later.
- Return to Conversion Funnels after activation to view the funnel at any time.
Hint: The main paths to purchase are obvious for most and should be funnelled first. These will be product to basket, search results to item, and basket to checkout. Other core website pages act as an additional level to these funnels. Start with these main funnels. Compare page performance as a conduit to sales or signups. Even A/B test pages to identify strengths. Use these insights to inform website development.
Defining Which Visitor Sessions to Record.
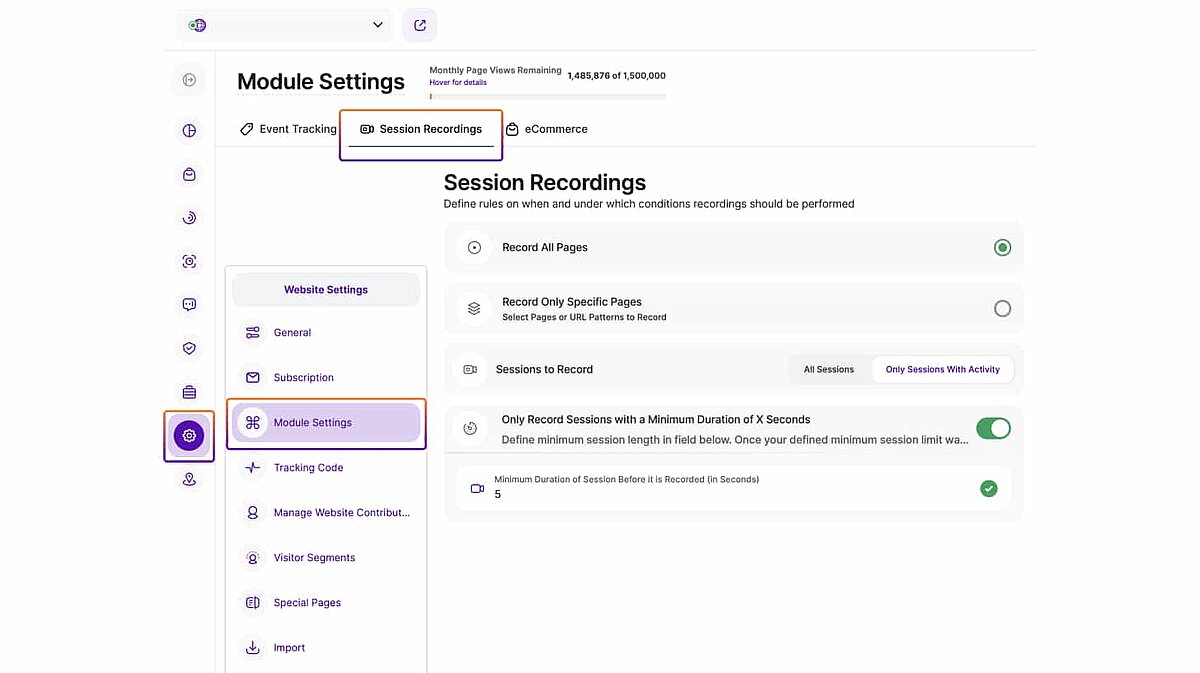
To customize the types of sessions to record, follow these instructions:
- Go to Website Settings in the vertical left-hand icon menu and click on Module Settings.
- Navigate to Session Recordings.
- Calibrate the five recording options to your preferences.
Hint: These settings are a great way to streamline the session replay library by removing the least interesting ones from consideration. Use it to adjust Session Recordings to record specific pages, only include active sessions, and set a minimum duration for the sessions recorded.
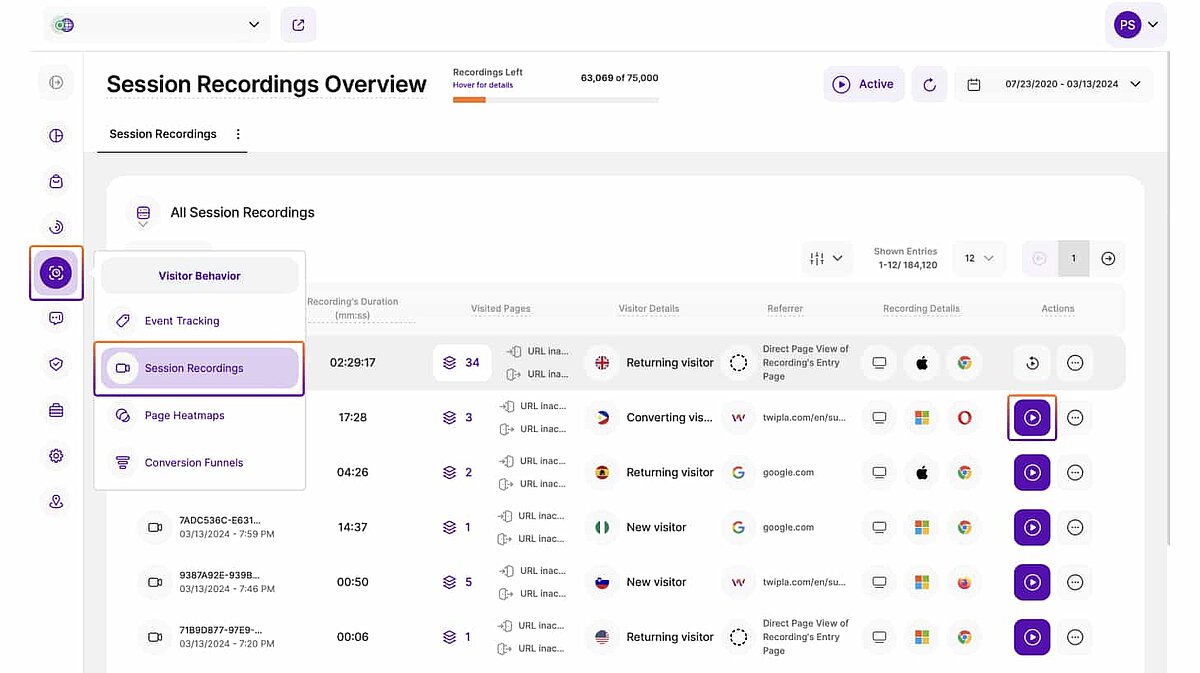
Watching a Session Recording.
To watch a session recording or replay, follow these instructions:
- Go to Visitor Behavior in the vertical left-hand icon menu and click on Session Recordings.
- Select a Session Recording from the generated list, and click on the Play button at the right hand side of the row.
- This will take you to the playback module, which you can manipulate like any standard online video player.
- Toggle on Skip Activity to jump past periods of inactivity.
Hint: Session Recordings answer questions raised by other tools, and are best approached when you've identified a page or site navigation issue that you want to explore further. Filter the recordings list down to the variables you're interested in, watch multiple replays, and search for common behavior patterns, pain points, and areas of interest.
Calibrating Auto-Tracked Default Events.
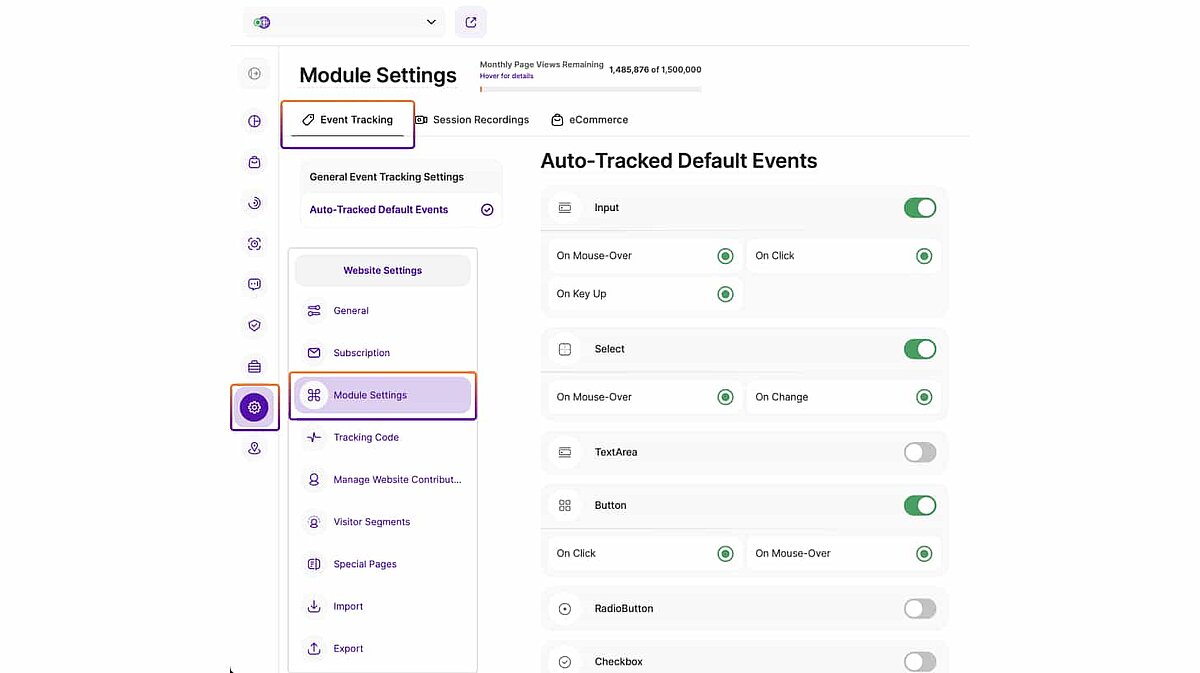
Auto-tracked events are part of Event Tracking that monitors granular website visitor interactions. They come auto-tracked, meaning that you can monitor them without touching webpage code. To decide which auto-tracked events to monitor, follow these instructions:
- Go to Website Settings in the vertical left-hand icon menu and click on Module Settings.
- Toggle Define Default Events for Auto-Tracking to switch on or off the tracking of any active default events collected by the Event Tracking tool.
- Edit the list of Auto-Tracked Default Events in Module Settings to decide which auto-tracked events to activate.
Hint: Controlling which auto-tracked events to enable is a good way to minimize data collection and get the toolkit focused on the events that matter to your business. If the website event that you want to monitor isn't an auto-tracked event option, you need to create a manual event.
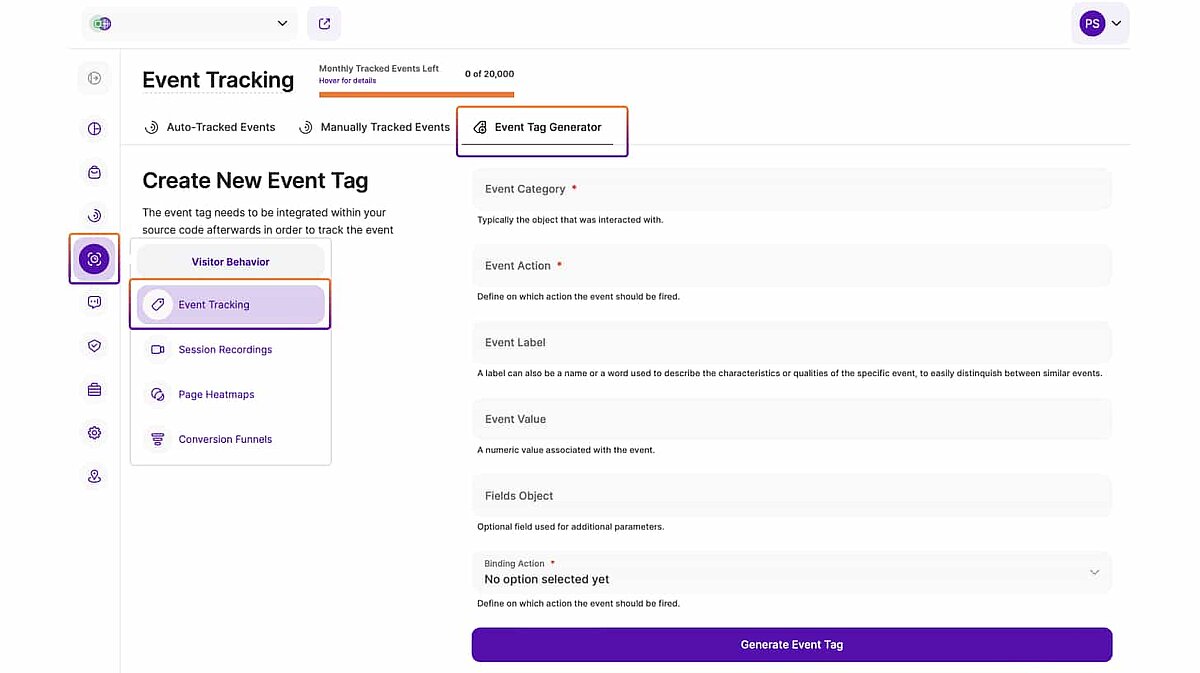
Creating a Manual Event.
To create a new manual tag for a website event that is not already auto-tracked by the analytics platform, follow these instructions:
- Ensure that manual event tracking is enabled. Go to Website Settings in the vertical left-hand icon menu. Click on Module Settings. Toggle on Track Manually Created Event Tags.
- Go to Visitor Behavior in the vertical left-hand icon menu and click on Event Tracking.
- Click into Event Tag Generator and define the custom event.
- Click on Generate Event Tag and paste the snippet into the source code of the element you want to track.
- Navigate to Manually Tracked Events to analyze data.
Hint: Since you'll need to identify manual tags from the variables entered in the Event Tag Generator, Event Tracking becomes much easier when you take a systematic approach to tag construction.
Creating a Poll.
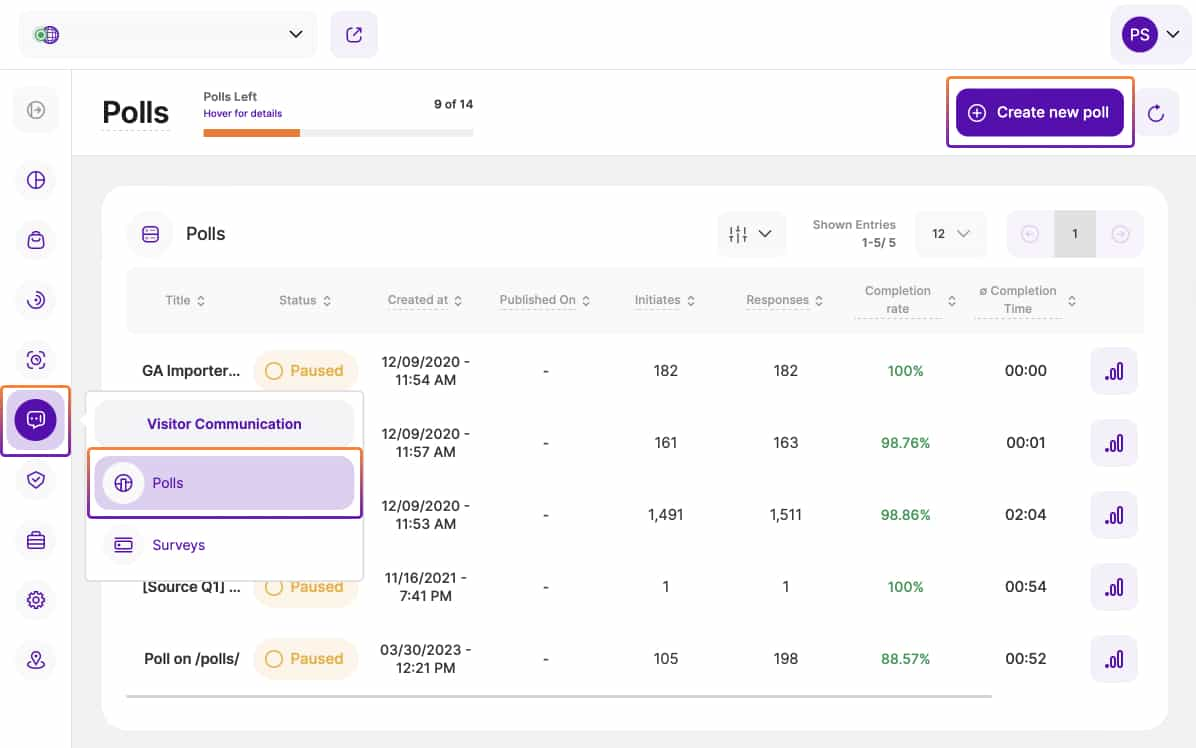
The Polls tool generates popup webpage feedback bubbles. To create the first webpage poll for your site, follow these instructions:
- Go to Visitor Communication in the vertical left-hand icon menu and click on Polls.
- Click Create New Poll at the top-right corner of your screen.
- Populate the poll with your questions, choosing the most suitable answer type for each.
- Set rules-based targeting to control which website visitors are presented with the poll.
- Customize the appearance to match the design of the targeted webpages.
- Click Publish at the top right of your screen, or Save as Draft until completion.
Hint: Polls provide a great opportunity to catch website visitors as they browse, and to ask questions relevant to their navigation experience.
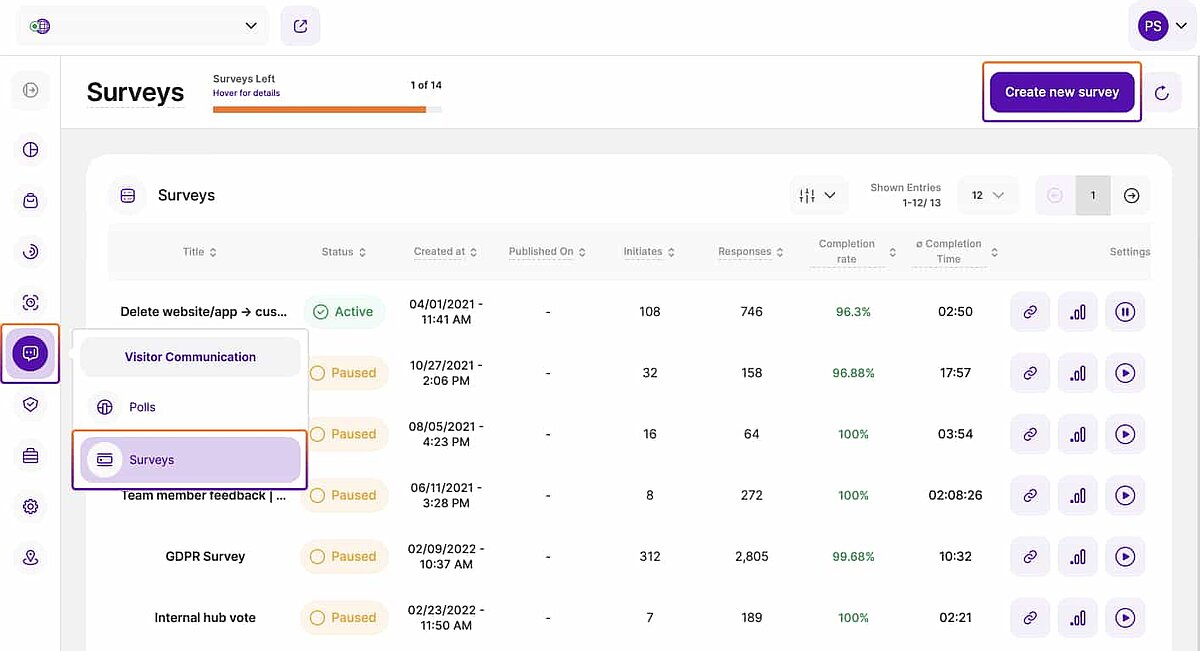
Creating a Survey.
The Surveys tool generates dedicated pages of questions for internet users. To create the first webpage survey, follow these instructions:
- Go to Visitor Communication in the vertical left-hand icon menu and click on Surveys.
- Click Create New Survey at the top-right corner of your screen.
- Populate the survey with your questions, choosing the most suitable answer type for each.
- Toggle survey settings to your preferences.
- Customize the appearance to match the design and branding of your website.
- Click Publish at the top right of your screen, or Save as Draft until completion.
- Copy the URL and paste it into marketing materials.
Hint: Since each survey has its own link, you can use them to collect feedback via any online channel. Once done, you can go to the module to analyze results and also make changes to active surveys on the fly.
Updating Billing Information.
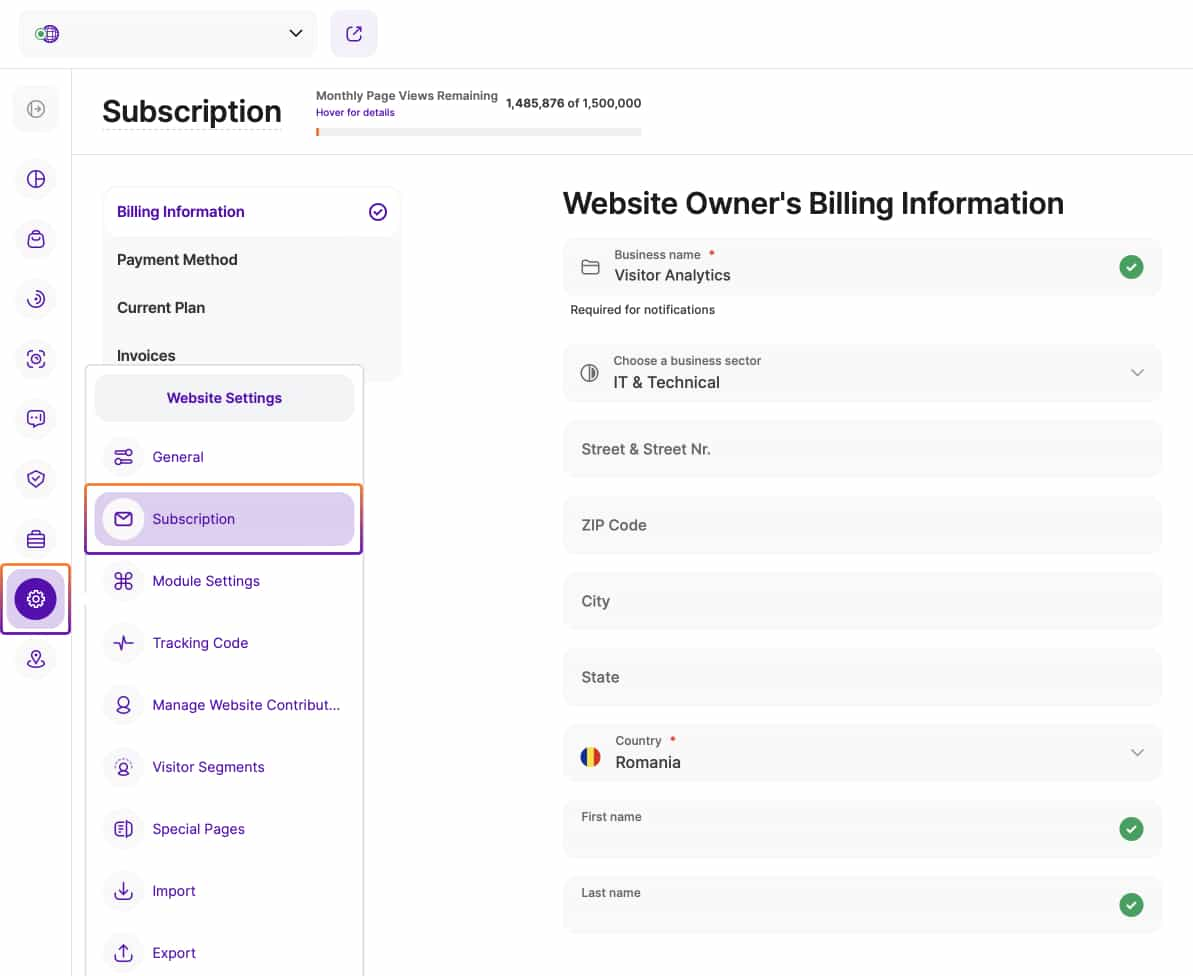
To update your account's billing information, follow these instructions:
- Go to Website Settings in the left-hand horizontal icon menu and click on Subscription.
- Update your billing address, payee name, or credit card details.
- You can also turn off auto-renewal here if you don't to want continue paying after the current billing cycle ends.
- Click save at the top right corner of your screen so you don't lose changes.
Note: Make sure you update this information promptly if your billing details change. This will prevent any potential disruptions in service and maintain access to important website intelligence tools and data.
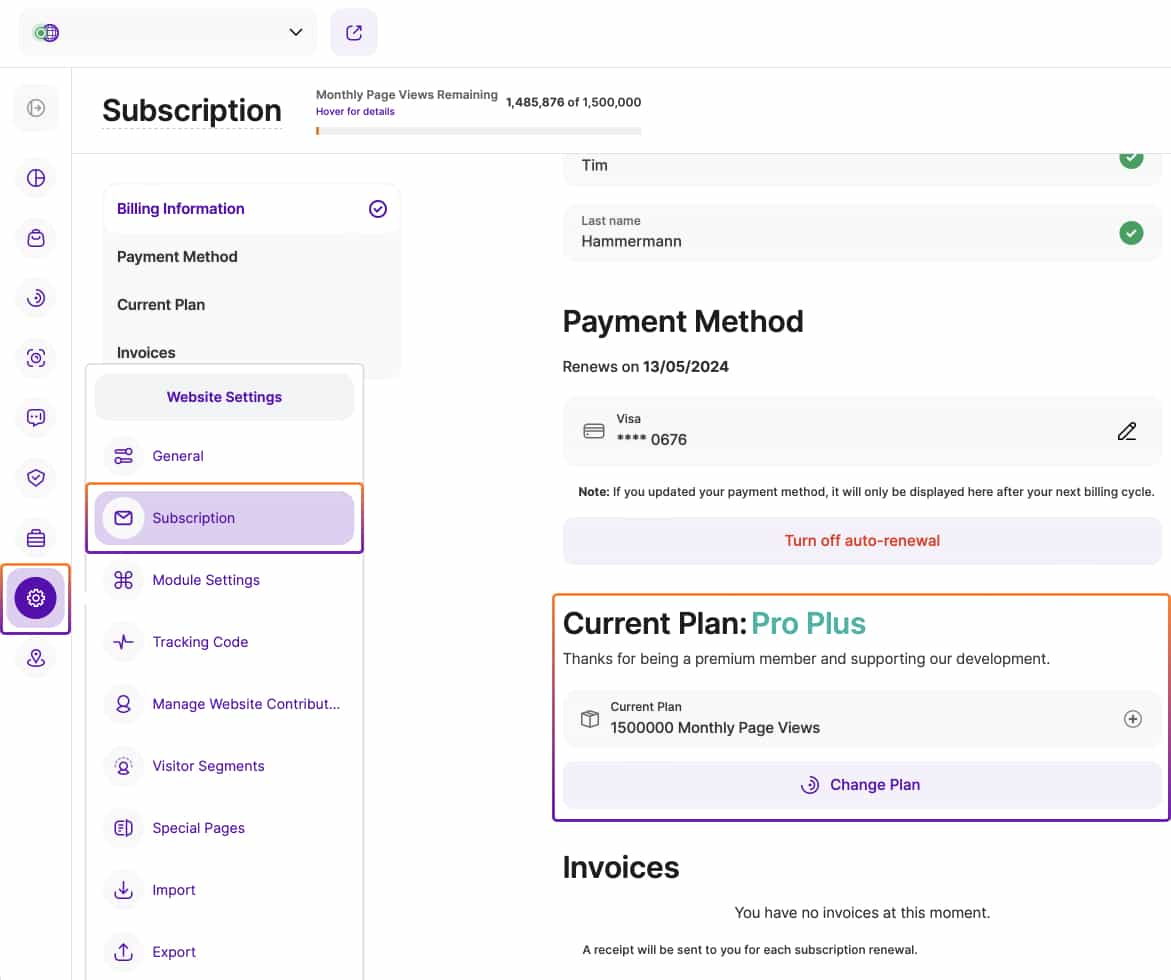
Verifying Your Current Payment Plan.
To verify your subscription and the renewal date, follow these steps:
- Go to Website Settings in the left-hand vertical icon menu and click on Subscription.
- You'll find a snapshot of your current payment plan below the billing details and payment method.
Hint: It's wise to regularly consider your payment plan to ensure that it aligns with your business needs, that you have the functionalities that you need, and that you're not paying too much for website intelligence.
Changing Payment Plan or Subscription Package.
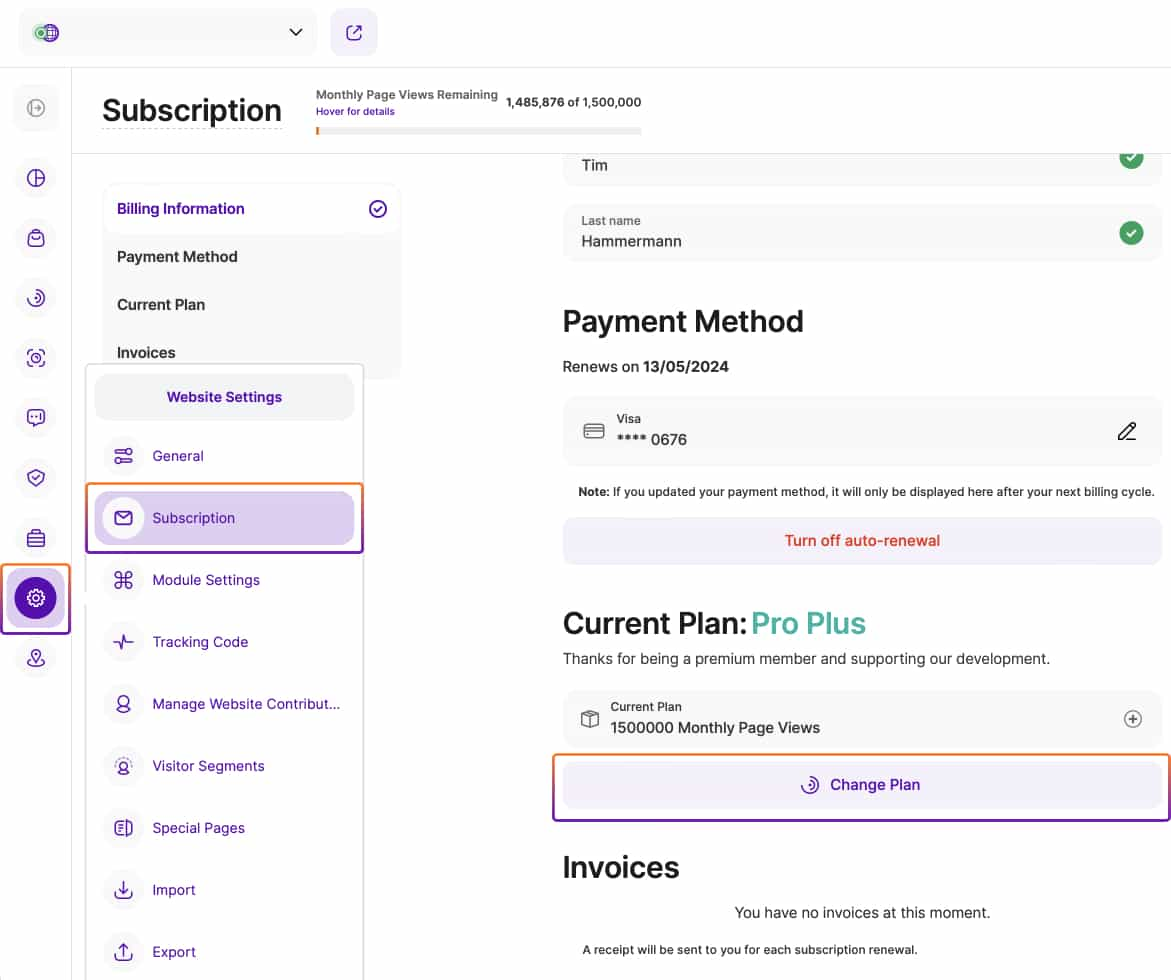
To change your pricing plan or package, follow these instructions:
- Go to Website Settings in the left-hand vertical icon menu and click on Subscription.
- Click on Change Plan and select a different option from the dropdown menu.
- Select whether you want a monthly or yearly plan.
- Optionally, add a voucher code or additional invoice content.
Hint: Once updated, the new plan will come into effect at the end of the current payment cycle. Only pay the subscription that matches your traffic volume, and use all tools to maximize the insight potency.

Choosing the Right Subscription Package.
When selecting the optimal analytics package for your business, it's essential to consider the value and capabilities of each option and how these grow as you move up through the different subscription levels. Ultimately, the pricing plans have been designed to align the functionality with each business growth cycle. This makes it important to assess your current website traffic numbers so as to select the option that's right for you in the current moment.
Free Plan: Getting Started.
The free plan is ideal for online businesses that are just starting out. It has a low data collection threshold that mirrors expected traffic levels for small businesses, but subscribers still have access to the vast majority of website statistics, behavior analytics, and visitor communication modules. This gives you the opportunity to test and build familiarity with the analytics toolkit, making it an excellent entry point for newcomers to the platform.
Flexibility to Scale.
As your business, website, and online traffic grow, you have the flexibility to choose when to move up (or down) through the different subscription packages - something that can be done in-app by navigating to the Subscription section of Website Settings. Each tier offers increased data collection, advanced analytics capabilities, and enhanced communication tools to support your evolving needs.
By carefully evaluating your current requirements and anticipated growth trajectory, you can confidently select the subscription package that best aligns with your business objectives. With our scalable pricing plans, you have the freedom to upgrade seamlessly as your business expands and your analytics needs evolve.
Finding Your Legal Documents.
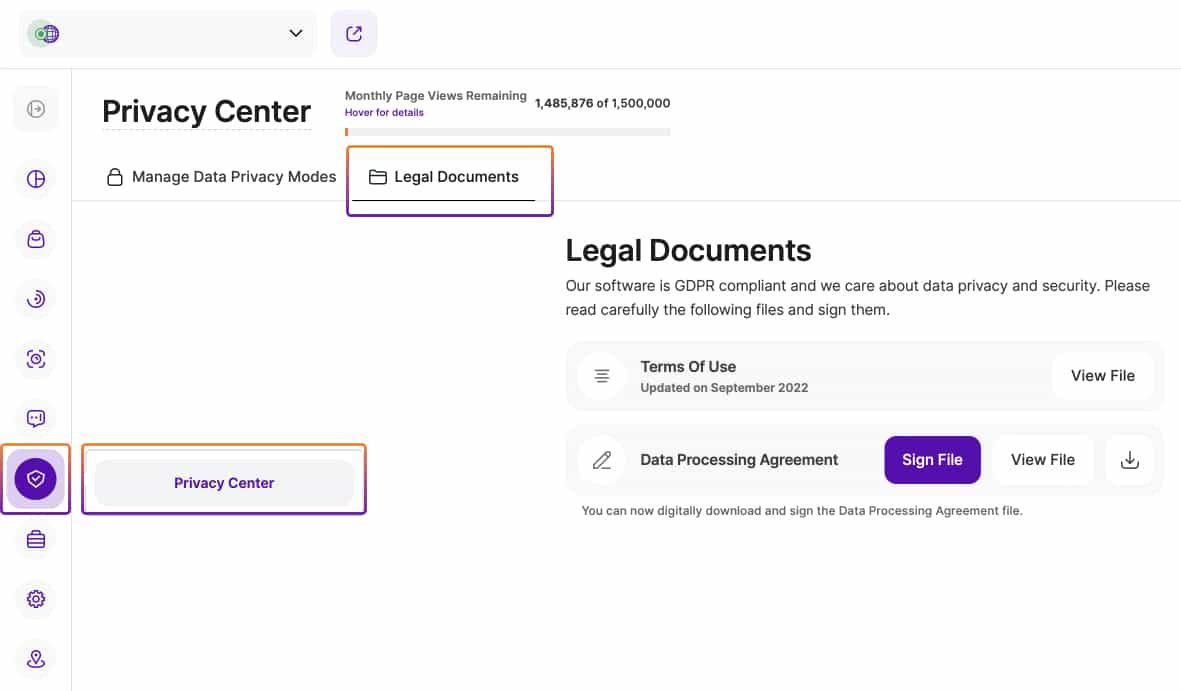
To retrieve your Terms of Use and Data Processing Agreement related to your website intelligence account, follow these instructions:
- Go to Privacy Center in the left-hand vertical icon menu.
- Navigate to the Legal Documents submodule.
- View or download the legal documents.
Hint: Review the Terms of Use and Data Processing Agreement to understand legal obligations, rights, and our data handling practices. This will ensure legal compliance and protect your rights as a user.