Simon Coulthard September 15, 2023

Marketing is a glamorous world and, as you toss the Bugatti keys to the valet at your beachside penthouse on the way to the infinity pool, you might find yourself wondering - “what is website analytics anyway?”.
It’s actually one of the most valuable weapons in the broad arsenal available to modern marketing professionals, given how reckless it would be to make important decisions about a website without knowing how it’s actually performing!
It’s difficult to imagine any company surviving in such a fiercely competitive world without using website analytics to guide improvements to what is typically their main source of revenue.
The numbers don’t lie - today, even 82% of small businesses use some form of website analytics and this figure is growing quickly (Blue Corona).
Given this, what is website analytics - apart from a game changer, cost saver, and reputation maker?
As with all things, it’s important to learn to walk before you can run, and we’re here to get you up to speed, Haile Gebreselassie 🇪🇹!
This hub will teach you everything you need to know about what website analytics is, what features it includes, and how to utilize its benefits effectively.


What is Website Analytics?
Simply put, website - or web - analytics is the collection, reporting, and analysis of data related to the traffic to your website and its various components - webpages, photos, videos, and links etc.
What website analytics is - ultimately - is a digital marketing and sales tool that gives you an understanding of your website from the perspective of your visitors themselves.
These tools - like TWIPLA - will tell you where they came from, how they found your site, what pages they look at, and which content they spend the most time on. They're invaluable integrations, and will undoubtedly remain invaluable in the future of digital marketing.
Website analytics provides businesses with important performance metrics that include:
- Page views - the number of internet users that visit a specific webpage
- Sessions - the number of single journeys by specific internet users through your website within a limited time period
- Traffic source - the site or channel of origin from where internet users arrive at your website
- Conversion rate - the proportion of internet users who perform a desired action (the most important ones being signup or purchase)
- Bounce rate - the proportion of website visitors who leave your website after viewing one solitary page
- Exit rate - the proportion of internet users that leave the website from a specific webpage
- Repeat visitor rate - the proportion of visitors who return within a fixed period of time
These are powerful insights for any company, and enable you to make informed, data-driven improvements to your website.
It’s why, out of all the martech in your stack, website analytics is the one you reach for when building, implementing, and assessing your website optimization strategy.
You’ll learn the effectiveness of your different marketing channels, identify and improve strategic issues, build a picture of your target audience, and create informed insights that can increase your conversion rates and drive revenue upwards.
You’ll also be able to measure whether wider company KPIs are being achieved, and by how much (or little).
History of Website Analytics
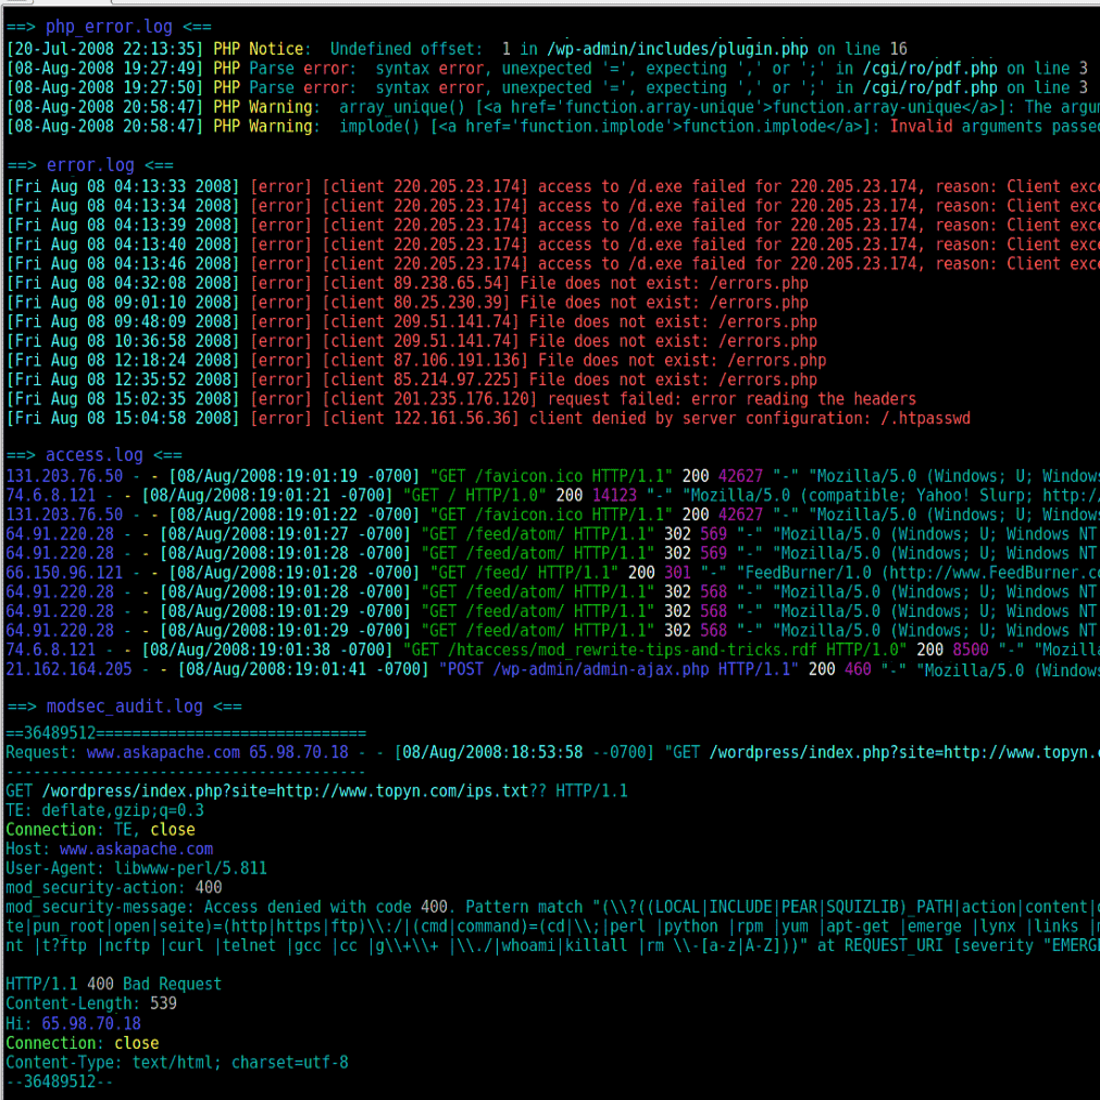
The internet became publicly available in 1991; but, if you ran one of the 600-odd websites that made up the world wide web back then and wanted to know the number of internet explorers it welcomed, you’d have had to dig deep into the server log.
A server log file is a simple text document with all the user activities recorded by a specific server during a given time period.
Extracting any useful insights from them was a nightmare best left to computer scientists.
However, this log file analysis gave rise to the first web analytics software, with WebTrends arriving in 1993.
Anyone surfing the world wide web in the heady days of the early 1990s might remember Hit Counters. This was the first analytics tool available to website owners - a simple, digital clock-like graphic that displayed the total page visit count, from data pulled out of the server log.
Time travel back to the 2020s and a lot has changed, but server logs are still as relevant to what website analytics is today as they were during Pearl Jam’s heyday. They still form the basis of modern website analytics platforms, with the main difference today being the interface on which the data is displayed (if you ignore the striking increase in the number of different statistics, measurements, and behavioral insights that it provides you with now).
It’s still interesting to look at their development over the years, with 2006 a landmark year in this regard. Beforehand, these tools offered little beyond a general overview of website performance. The arrival of Clicktale that year revolutionized what was possible, however, by providing marketers with a method of tracking website visitor behavior so as to improve page performance, conversions, and the all important user experience.
Since then, the website analytics industry has gone from strength to strength, and modern website analytics software incorporates advanced AI and machine learning into their algorithms.
Today, it’s a big industry, with a market value of $4.1 billion that is expected to nearly triple in size over the next five years (Business Wire).

Importance of Website Analytics
Tracking website performance is essential for any company that wants to stand out from the billions of other websites that exist online. It exists to boost sales, drive down costs, and allocate resources where they’re most needed, with the ultimate goal of increasing profit and market share.
It’s an ancient cliché in business that anything worth doing is worth measuring, and this has only become more prescient in recent years.
Big data analysis is now mainstream. It’s big business. It’s aspirational. It’s fetishized by any industry you care to shake a feather tickler at.
It’s not hard to see why, but Moneyball was a real Road to Damascus moment for anyone that remained unpersuaded about the potential offered by data to level the playing field. Moneyball is the uplifting story about how the lowly - sorry A’s fans! - Oakland Athletics baseball team used data analytics to beat much more illustrious - and far richer - rivals. They didn't win the World Series alas, but they gave it a good crack!
Beyond getting a generation of sports fans addicted to statistics, this story hammered home the point that, by harnessing the power of the data at their fingertips, businesses could outsmart opponents and increase their revenue in a highly competitive world.
The marketing world has certainly learnt that lesson - whether they realize it or not - and has applied it to website optimization work (among other things).
Websites are the most important online tool for businesses today, and it’s important to get them right. You might believe that yours is fit for purpose, but you need to know what your website visitors think about it - and you might be surprised.
Research shows that it takes roughly 50 milliseconds for users to decide whether to stay on your website, or to leave - presumably in disgust (BIT).
What’s more, only two out of every 100 visitors to your site will put their money where they’re browsing (Wordstream). Such important conversion rates are an understandably tempting area of your business to massage given the potential payoff, but you need to use more than guesswork to determine how to improve them.
This is what website analytics is all about. These platforms enable you to pinpoint the JavaScript problems, 404 errors, and rendering issues that affect your site’s usability and reduce conversions.
You can also test and review your website’s performance next to metrics like speed, traffic, SEO, user experience, and so forth. Each of these is a key determinant of how well calibrated and structured your site is, and directly affects its success.
When used effectively, these tools can turn any company into the next Oakland Athletics, and any marketing manager into the next Billy Beane (played by Brad Pitt in their own biopic, obviously).
Website analytics enables you to find out what visitors like about your website, and what they don’t, and you can then make informed improvements to your website accordingly.
Thanks to this tool, you can identify the best performing content, and see which blogs, articles, and landing pages are not informative, eye-catching, or interactive enough. In this way, you can pinpoint the most popular pages on your website and the most well-trodden paths to purchase.
What’s more, you can learn where your website visitors live in the world and can adapt your outreach to suit. For instance, you might be a Munich-based company but learn that you’re getting a large proportion of hits from Stockholm. WIth this in mind, you could then consider prioritizing Swedish translations, or providing information relevant to your goods and services in Stockholm - and hear those kroners ching.
Crucially, your traffic comes from different sources, and website analytics enables you to break down exactly how each of these channels contributes to your traffic numbers. As such, you can use website analytics to accurately track the performance of your various marketing campaigns and can incorporate insights learnt into future efforts.

How Website Analytics Works
You should now know a little more about what website analytics is, but it’s good to have some idea of what’s happening under the hood before using these tools to drive your marketing strategy.
Modern website analytics platforms work through page tagging, and this means that they work by collecting data via a tracking code that is inserted into your webpages’ HTML.

This JavaScript snippet logs all user actions during a specific visit or session, as well as information on device type, browser and - via the IP address - geographical location. The snippet then automatically pushes all this data into your analytics platform of choice.
Most of these tools also use cookies to track website visitor sessions and to identify repeat visits from the same browser. These are known as “third party” cookies, since they come from your third-party analytics tool, and are foreign subcontractors to your own website - think of them as the pool boy who’s enlightening his boss about those secretive dinner parties you’re famous for.
These cookies activate when someone arrives on your webpage and - unlike tags - are stored on their own personal internet browser after they leave. And, while some privacy-focused platforms use cookieless tracking - or variants that expire the moment users exit your site - others use persistent cookies that continue to record certain data on users long afterwards - some never stop!
The data collected from these tags and logs is then analyzed, with some analytics platforms integrating artificial intelligence and predictive modeling into this process - technology that is changing the future of digital marketing. The result of this is the reports, charts, and other visualizations that the platform provides you with, and which you can then use to guide your website optimization work.
How to Use Analytics to Improve Your Website
You can improve your website through website optimization, which refers to the activity of carrying out controlled, data-driven experimentation so as to boost a website’s performance in line with wider business goals and KPIs.
When doing this work, it’s important to keep in mind that, while your website analytics tool does most of the heavy lifting, it’s still just one part of the wider process.
This involves setting business goals, comparing them with the insights pulled from the software, building an effective website marketing strategy, and carrying out improvements successfully. It’s normally broken down into the following five stages:
1. Establish Business Goals
The first stage of website optimization is to define the key metrics that will determine the success of your website and the improvements that you will eventually carry out.
These are different from company to company, but the ultimate goal is generally to make the website as appealing as possible to visitors, to increase its search engine ranking, and to drive conversions and sales.
2. Collect Website Data
The second stage is the collection of raw data on your internet traffic, which is done using your website analytics tool.
It records visitor actions, such as traffic source, sessions, page views, and clicks.
The objective here is to collect this data as accurately as possible - and this means ensuring that the website analytics tool is working properly and is calibrated to the data points you want to collect.
3. Process Data and Create Reports
The third stage is the conversion of this data into meaningful ratios, KPIs, and other information that tells a useful story about your traffic.
This is normally carried out by your website analytics tool, which digests the data set, before providing a report in an easy-to-read format.
However, you can also migrate the data to another platform or spreadsheet for analysis if you wish.
4. Develop Website Strategy
The fourth stage of optimization work is to take the insights gleaned from your analytics report and use them to formulate a website improvements strategy that will best enable you to meet the business goals that you set at the beginning of this process.
Your strategy could be something small, like increasing the conversion rate on specific pages, or it could be a more sweeping initiative that focuses on making money, reducing marketing costs, or increasing market share.
5. Carry Out Improvements
The final stage is devising an action plan from your website strategy and carrying out all the tasks involved effectively.
Your website strategy will dictate the priority of the various elements involved and you can use your website analytics tool during this process to immediately understand whether the work is being done properly.
While following these five stages means that you will get the most out of what website analytics is able to do - and be able to carry out website improvements in line with wider goals - it’s important to remember that optimization work is never finished.
It’s cyclical, and you’ll need to regularly return and restart this process - to assess the effectiveness of previous work and to identify further areas for improvement.
Your company’s business goals will also change over time, as will search engine algorithms and user preferences - meaning you’ll be coming back to website optimization again and again.

When to Use Website Analytics
You should now have some idea of what website analytics is and why these tools are such a vital part of an effective website optimization strategy.
But the value of these key numbers and bounce, exit, and conversion rates means that analytics platforms are crucial to a wide range of marketing activities:
A/B Testing
A/B testing - otherwise known as split or bucket testing - is the process of comparing two versions of a webpage against each other to work out which one performs better.
And, by A/B testing smaller and smaller differences to the layout - CTAs, color scheme, and so forth - this experimentation enables you to identify which option will get the most conversions.
Target Audience Identification
Website analytics tools provide key metrics about where your audience lives geographically, what content they engage with the most, and which web pages they spend the most time on.
You can then use this information to optimize your webpages to the market segment most likely to buy from you.
User Experience Optimization (UXO)
UX describes how people feel when navigating your website, whether they can find the information they need, and how easy it is for them to access, review, or buy your products and services.
It's very similar to CX, though focuses on users rather than customers (who are not always the same people).
You can use website analytics to track user experience metrics, identify bugs and drop-out points along the buying journey, and then use these to inform the design process.
Campaign Management
Thanks to UTM tracking codes, website analytics can show you the proportion of website visitors that arrive on your web pages from your various marketing channels.
You can use this data to identify which campaigns are performing well and which aren’t enticing enough people in, and can then make adjustments to your strategy and budget accordingly.
Search Engine Optimization (SEO)
Website analytics enables you to track the metrics and data points that most impact how search engine algorithms rank your website in the results they generate.
These include how long visitors spend on your pages, how much they read, which external links are referring them there, the bounce rate, and so forth. You can then use these insights to guide the work required to improve your website’s SEO.
Product Improvements
Website analytics can help you TO understand exactly why customers want to buy from your company, what they like about your products, and what distinguishes you from your competitors.
You can then use these insights to develop your range of products or services, so that they are more appealing to the people that matter most.

Three Categories of Website Analytics

When people talk about what website analytics is to them, they normally mean website performance statistics - with Google Analytics the most famous example of this category of tools.
However, website analytics has increased in sophistication over the years, and now includes visitor behavior analytics, as well as visitor communication tools.
Some website analytics companies focus on one, some focus on all three, and this section will run through what these are in more detail:
1. Website Performance Statistics
Performance statistics represent what website analytics is for most people.
They act as the foundation for your analysis toolkit and the launchpad from which to make data-driven changes across your website.
Unlike the other two website analytics categories, which use qualitative research, website performance statistics are calculated from quantitative - or numerical - data.
Simply put, these analytics tools provide you with the crucial, raw numbers, rates, and key metrics that enable you to see how your website is performing.
There is some overlap given the nature of this category and its data, but they are normally divided into the following areas:
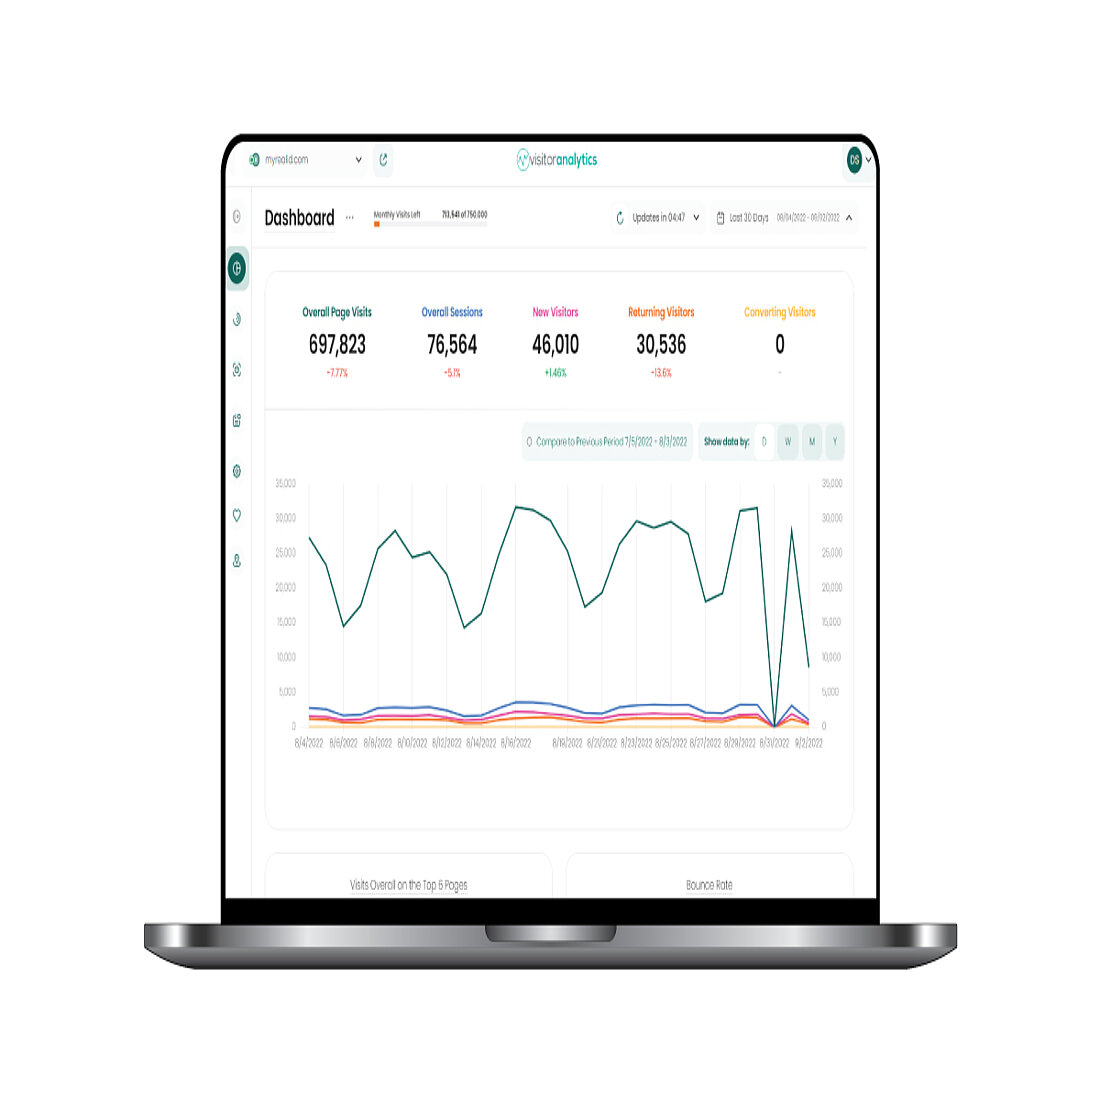
1. Analytics Dashboard
The analytics dashboard displays all the most important numbers and measurements in one place.
You’ll be able to see statistics on overall page visitors and sessions, on new and returning visitors, and the all important proportion of users that have completed specific actions.
This feature enables you to see how things change over time - you can view data in daily, weekly, monthly, or yearly intervals, and can easily compare different time periods of your choice.
The figures also update almost immediately, enabling you to respond quickly to any developments or trends that emerge.
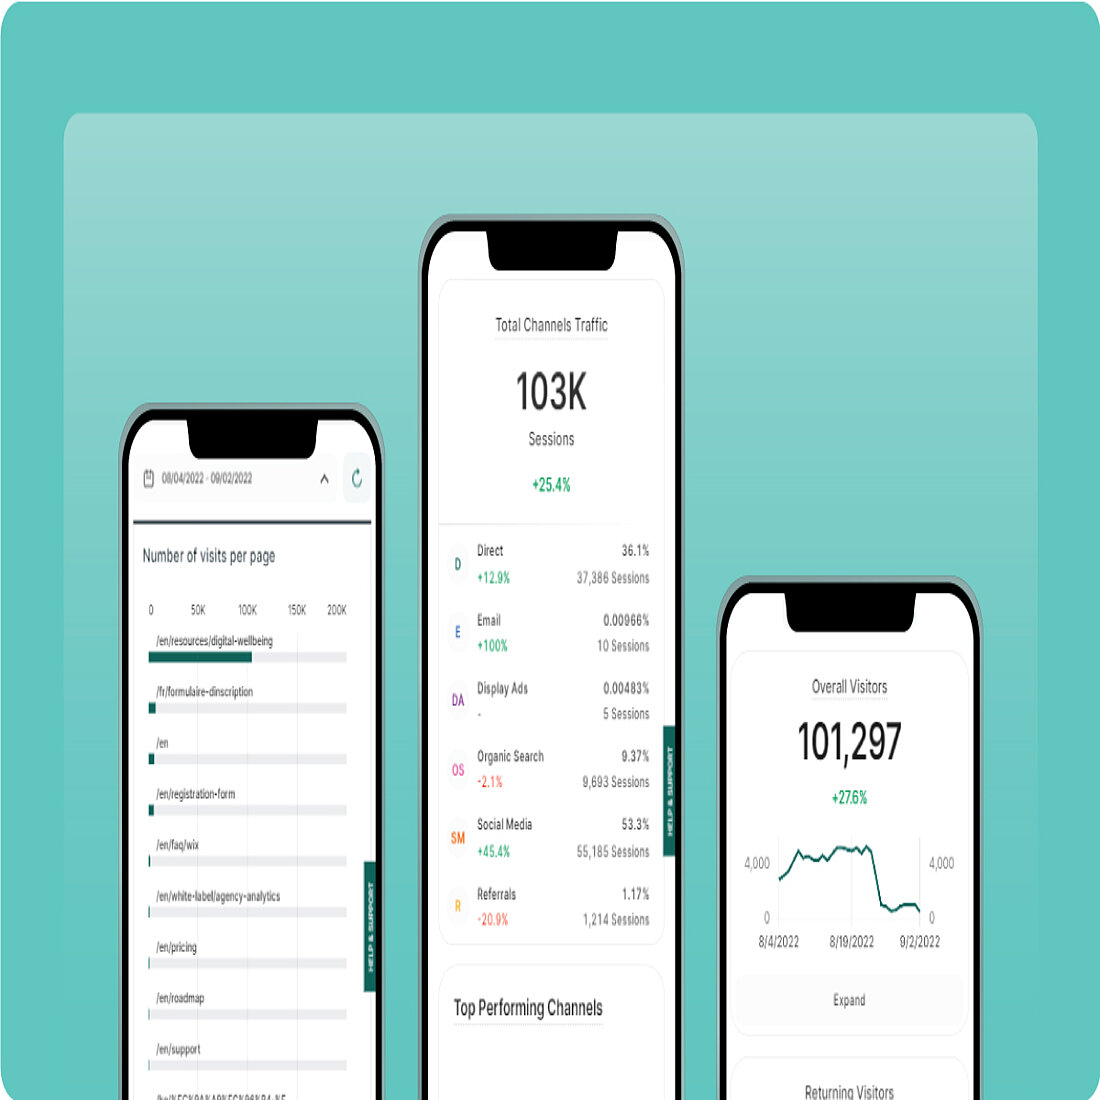
2. Traffic Structure
Your website analytics tool is able to provide important data on your incoming website traffic by breaking it down by source. At a glance, you can learn:
- How much of your traffic arrives organically to your website
- Which channels are bringing the most visitors to your website
- What is the average session duration for visitors from each channel
- What is the bounce rate for visitors from each channel
These are all powerful insights about the effectiveness of your various marketing channels and campaigns. For, by pinpointing which are working well and which aren’t bringing enough internet users to your website, you can make informed decisions about where to invest your time and resources.
3. Visitor Statistics
Your analytics platform will provide far more information on your traffic than simply where they originate from online, including the average time spent on different pages, whether they’re a new or returning user, and how they navigate through your website.
You’ll also see which content attracts the most traffic, and when it is most popular, and you can then use these insights to guide improvements or optimize your publishing schedule to your audience.
This tool will also provide figures on the geographical distribution of your global audience by country and city, and you can then use this information to create customized content and offers, as well as precisely targeted advertisements.
4. Page Performance
Website analytics enables you to view website performance data from the perspective of each individual page, enabling you to quickly identify which ones are popular and which aren’t attracting the desired interest. You’ll also be able to dissect how users interact with all the various links, CTAs, videos, and content.
This data will help you understand which pages your website visitors land on first. And by identifying the popular pages, and how users behave when they first arrive, you can then make improvements to increase the conversion rate.
You can also unpack referral data, and see which campaigns are directing the most prospects to your website. This traffic can be further dissected, and you can use this information to optimize the content they see to increase the likelihood that they will buy something from you.
And, by breaking down your overall website performance by individual page, you can optimize them to their specific audience or purpose with informed, data-driven improvements.
5. Hardware Information
Your website analytics tool will provide data on the type of device and operating systems that your visitors are using, as well as their screen size and choice of browser.
You can use these insights to optimize web pages to the technical specifications of your visitors and improve the all-important user experience according to your website performance measurements.
6. Competition Analysis
Your website analytics tool enables you to compare the performance of your website with those of your competitors.
It draws on raw data and predictive modeling to provide insights on how your key performance measurements compare with other companies in your sector, and provides a useful roadmap for future improvements.
7. Campaign Performance
Your website analytics platform enables you to easily assess the success of your various marketing campaigns at a glance.
You’ll know where your visitors come from, what content they look at, and how they behave across your website.
You can use these insights to make effective decisions about your outreach and see how to best adapt pages to your target audience.
8. Social Media Tracker
Social media trackers monitor the performance of your social media campaigns.
This tool provides data on everything from audience growth, engagement, and conversion rates to your video completion levels, Net Promoter Score, and Cost-per-Click, and you can then use these insights to optimize your social media strategy.
9. Sessions
Sessions provide crucial information on the number of times that specific internet users visit your webpage, and what they do while they’re there - with a single session ending when they leave your website.
This data is crucial for evaluating whether your marketing and SEO campaigns are working, and how to improve the user experience for your visitors.
10. Compare traffic
Your website analytics platform will show you how many of your website visitors are direct traffic, and the number that arrive on a webpage from emails, organic searches, referrals, and so forth.
You can also learn the average number of pages viewed by visitors from each of these channels, and can tailor changes to improve their bounce rate.
2. Visitor Behavior Analytics
Visitor behavior analytics goes far deeper into the data than website performance statistics.
Think of these tools as providing you with data on the quality of your visitors’ experiences across your website.
This category includes a range of qualitative analytical tools that enable you to measure your website’s performance, understand visitor behavior, and identify dead ends in their journey.
These visitor behavior tools provide you with a detailed picture of how critical web pages like your homepage, landing pages, and product pages are performing.
The insights you can glean will help you to make changes that will increase their engagement, remedy their pain points, and optimize the user experience.
This category of behavior analytics tools encompasses heatmaps, event tracking, session recordings, and conversion funnels, which will each be looked at in more detail below:
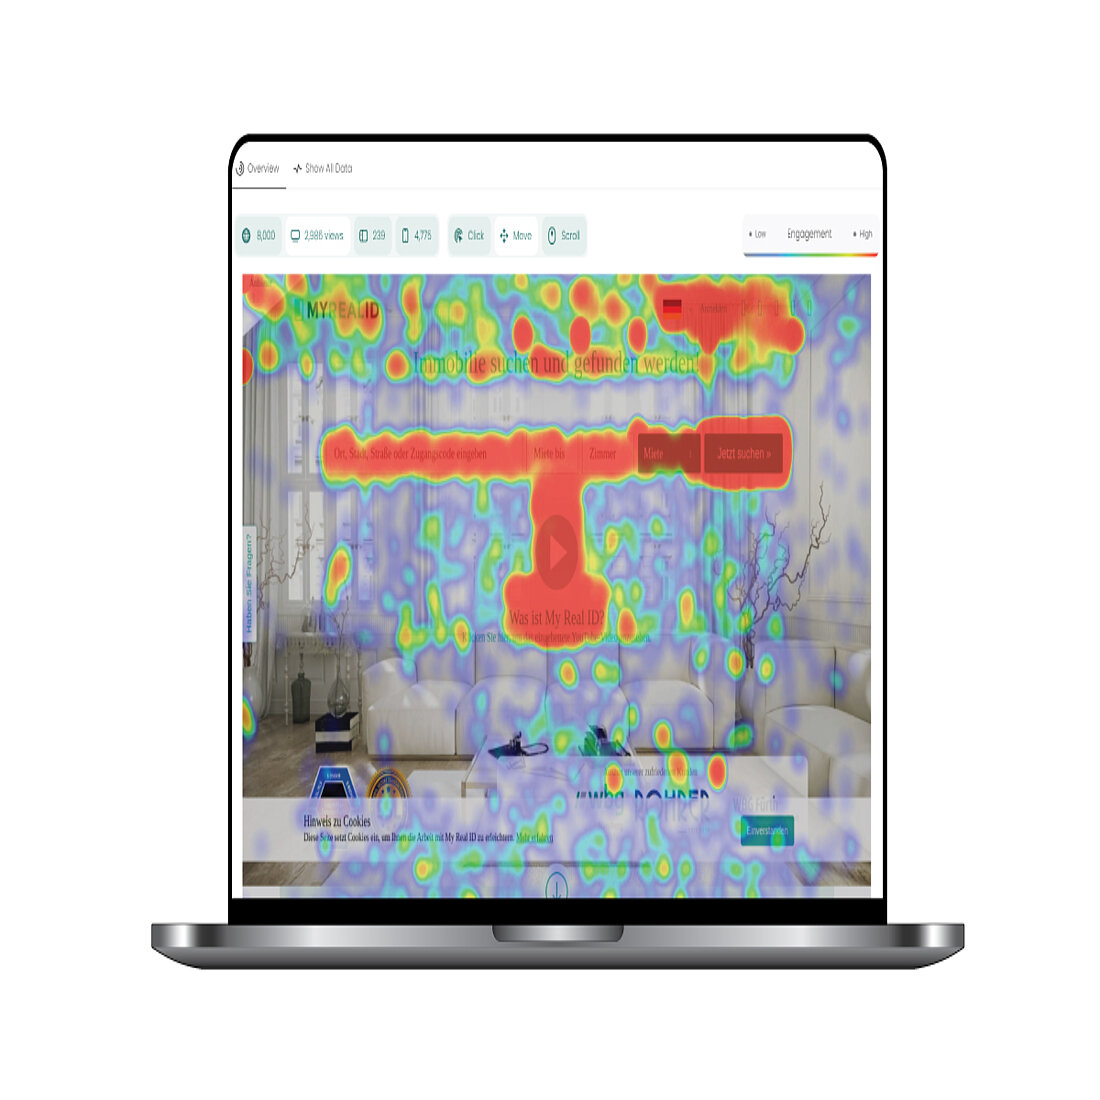
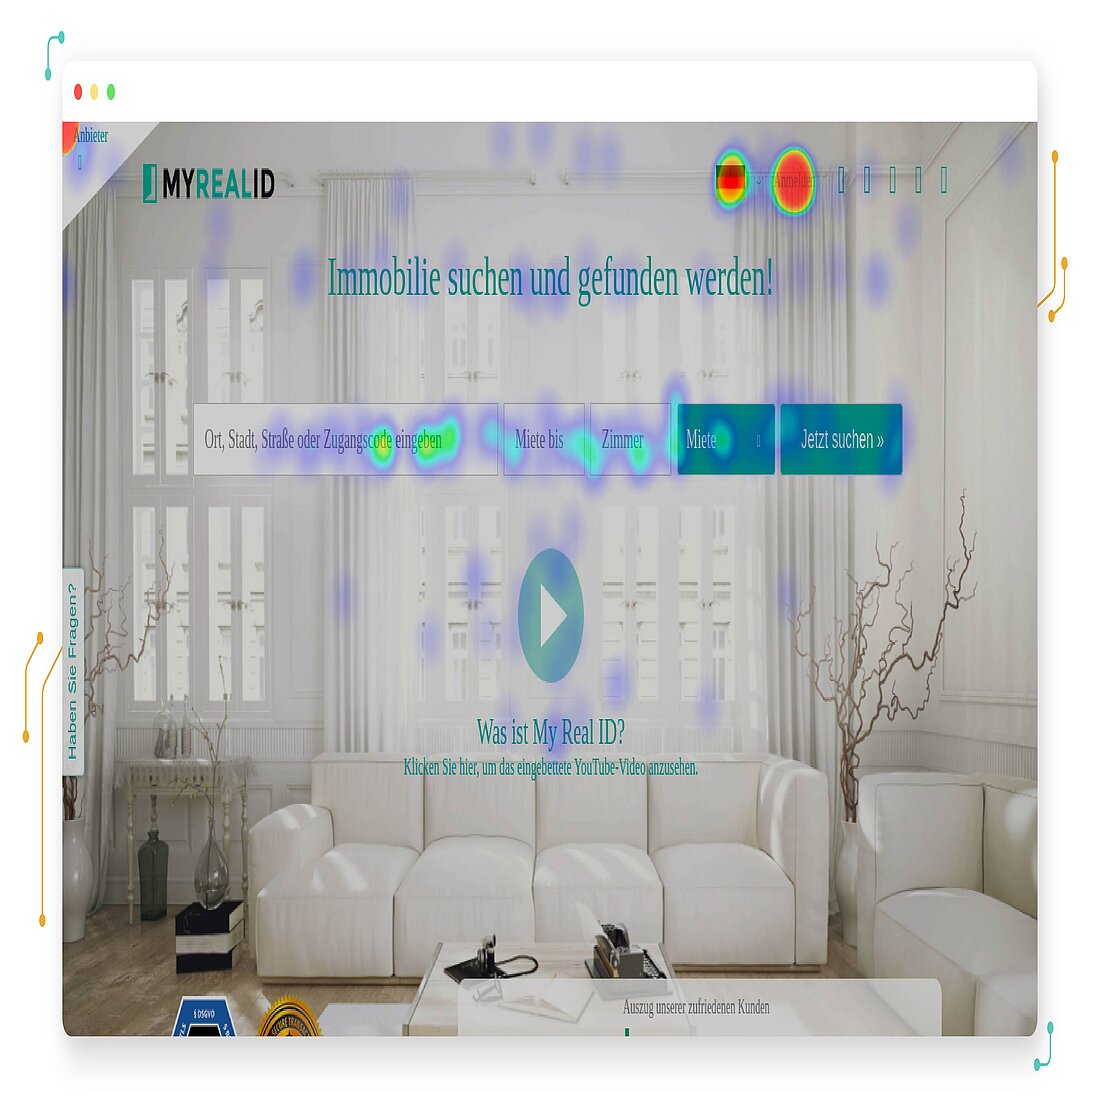
Heatmaps
A heatmap, in the digital marketing world, is a graphic overlay that enables businesses to see how and where internet users interact with a web page - the warmer the color, the more interactions there are.
They are a powerful tool for understanding which elements they click, how far down they scroll, what they interact with, and what they ignore.
Since heatmaps take a wide range of complex data and overlay it on the web page under investigation, they are an intuitive and easy-to-understand analytics visualizer.
They’re great for bringing to life what can otherwise be boring or impenetrable data, and are invaluable for the deep analytical work behind website optimization.


Event Tracking
Event tracking - otherwise known as action tracking - normally refers to all the actions taken by website visitors. Conversions are the most commonly tracked event, but others include link clicks, video views, and downloads.
Event tracking helps you to identify and understand common patterns of user behavior.
This feature provides context to the time internet users spend on your website, beyond simple page visits and action counts, and enables you to better understand their motivations around each touchpoint.
You can see what people are engaging with (and what they’re ignoring), and can use this information to make changes to your website and marketing campaigns, so as to increase the frequency of specific events.
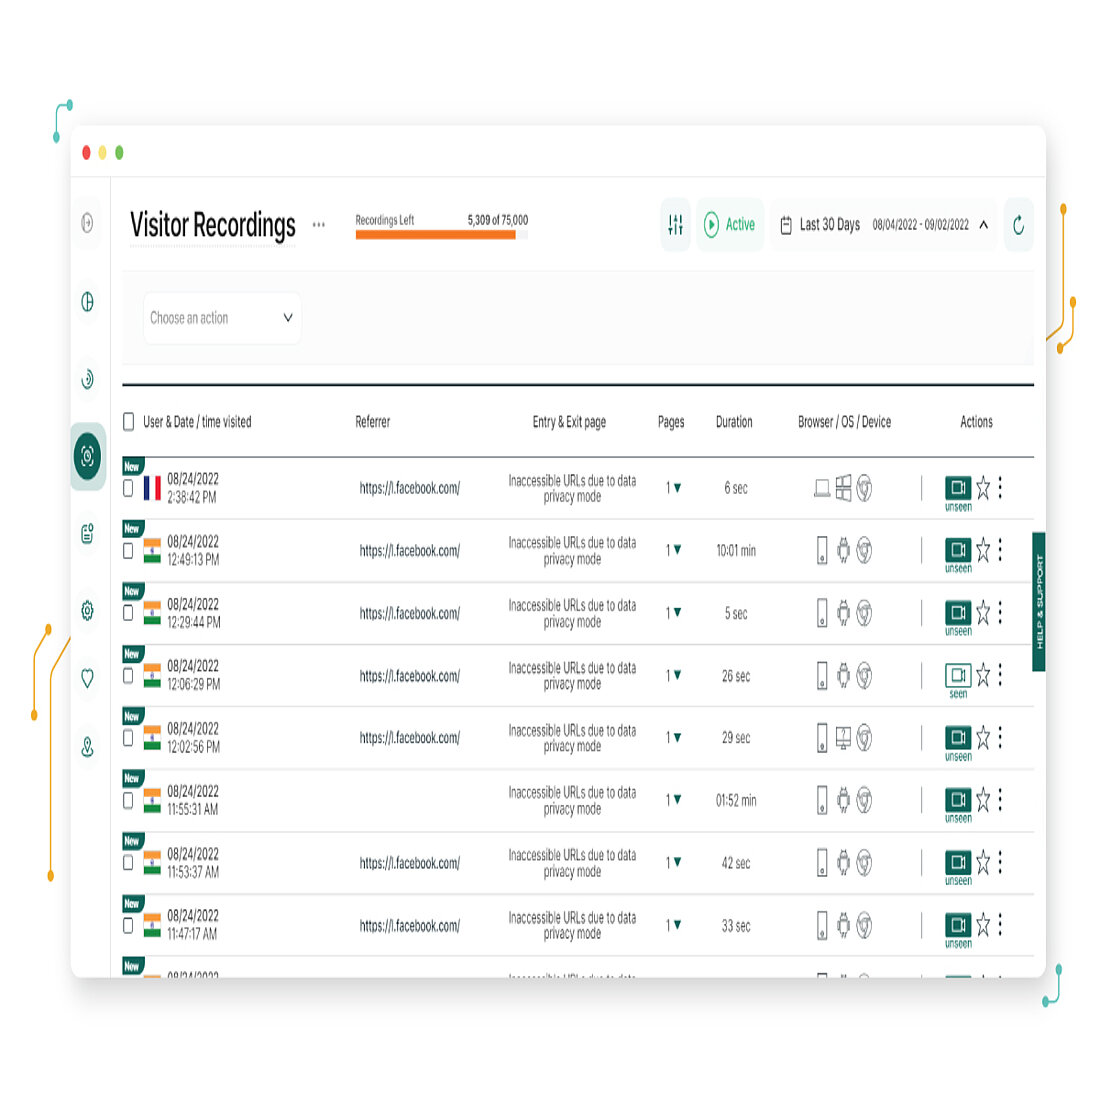
Session Recordings
Session recordings - also known as session replays - document all the real actions taken by individual users during a single visit to your website. They capture all mouse movements, clicks, taps, and scrolling across your webpages, as well as information on device type, operating system, browser choice, and so forth.
You can then replay a generated video, and look at your website through the eyes of specific users as they navigate around it.
Session recordings are a powerful way to assess website visitor behavior, and to see how intuitive your website is from their perspective. You can also identify broken links, bugs, and glitches, improve the site’s usability, and optimize the overall experience.
Session recordings are also a highly effective way of identifying buying intentions, which can then be used to shape marketing campaigns and product development. They help you to see what pain points they come up against and what might make them abandon their journey to purchase. You can use these insights to increase your conversion rates.
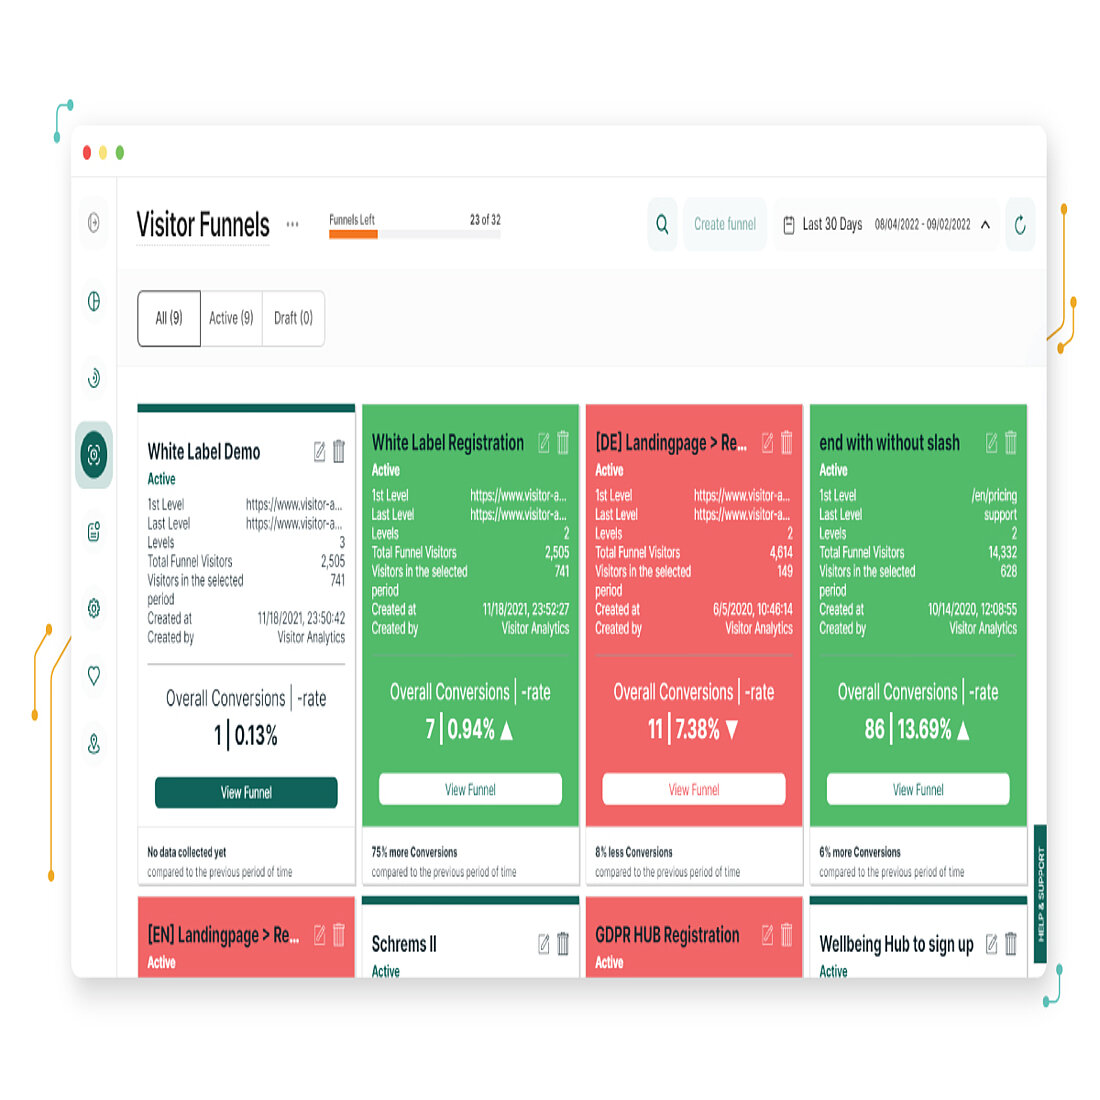
Conversion Funnels
Conversion funnels - also known as sales funnels or AIDA (Attention, Interest, Desire, Action) models - map out the different stages in an internet user’s journey that lead up to a desired action.
They’re called funnels to reflect the role of marketing in leading prospects through an ever-narrowing number of options and towards key company objectives like purchase or signup.
Simply put, this tool enables you to see the site from the point of view of your hottest leads, and to anticipate what will increase the likelihood that others will convert.
You can easily visualize the route that potential customers take as they move through your website, and towards whichever action you want to track in detail.
Conversion funnels provide a useful framework through which to analyze your marketing strategy, and to pinpoint areas to improve. With them, you can find out what motivates buyers, what turns them off, and what you can do to improve the customer experience and build their confidence in your company.
3. Visitor Communication
Visitor communication is really part of the category of visitor behavior analytics covered in the previous section, since it provides information based on similar qualitative research - enabling you to step into their Chuck Taylor All Stars and see what they see.
The key difference is that visitor communication analytics provides you with data that is collected from your website visitors themselves, in the form of direct feedback.
This category of tools encompasses website surveys, online polls, and live chat, which will each be looked at in detail below:
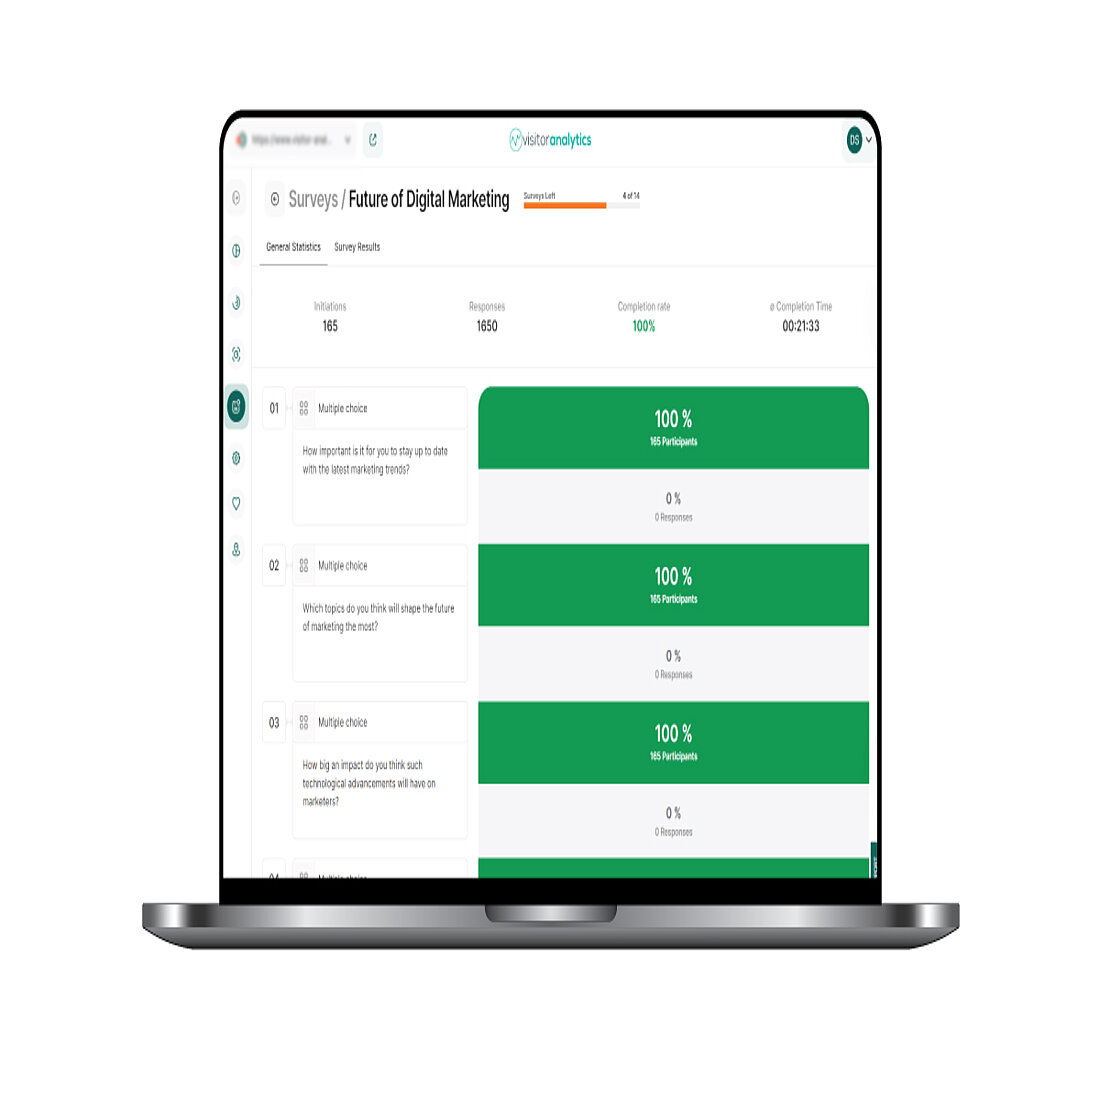
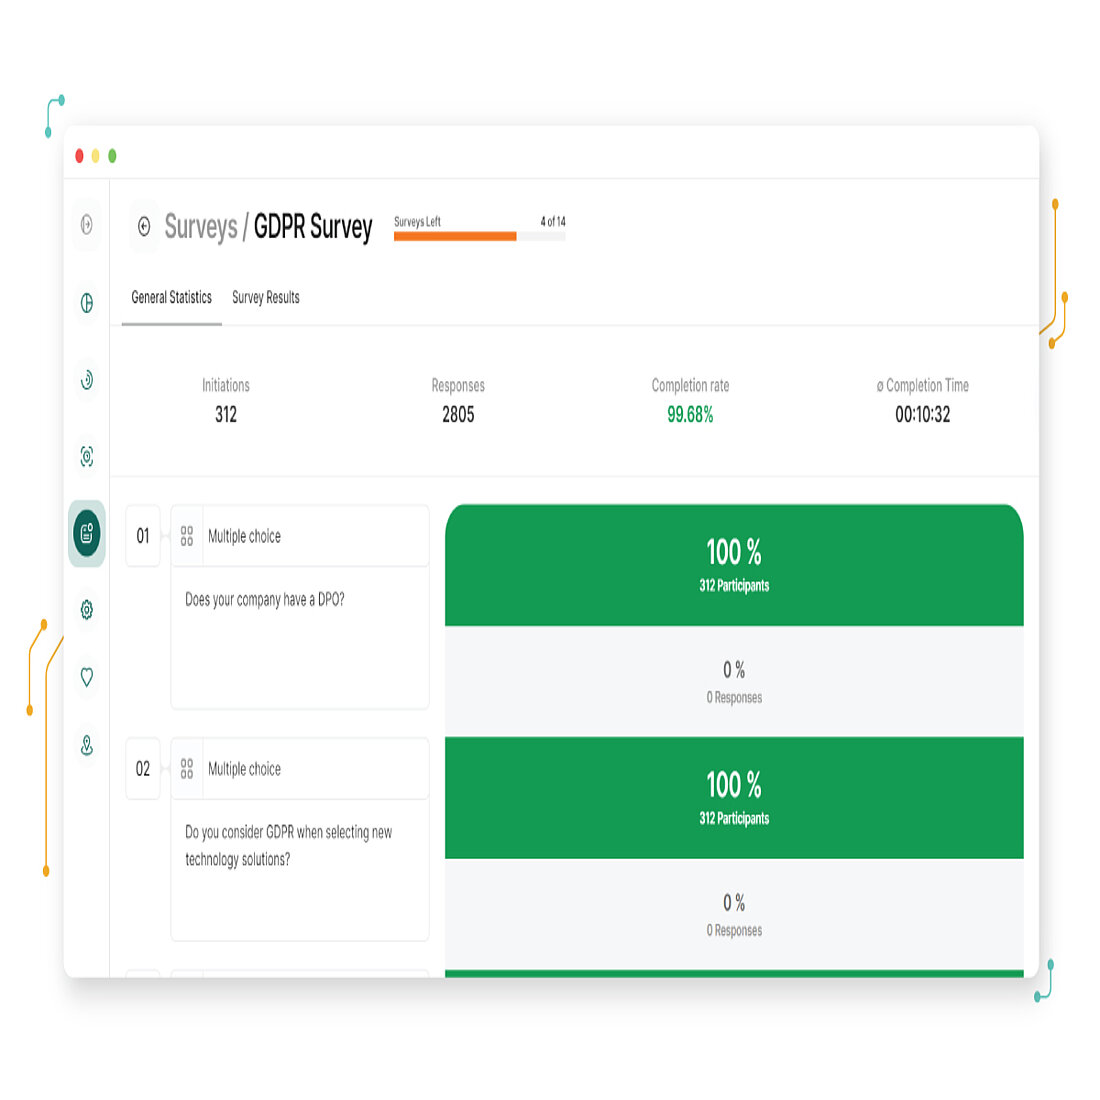
Web Surveys
Web surveys - otherwise known as web intercept surveys - are questionnaires that you send to website users.
For analytics platforms with this feature, they can be set up quickly, and enable businesses to collect feedback from visitors about their website, products, or any other aspect of their customer experience.
Crucially, surveys enable you to investigate the characteristics, behavior, and opinions of your website users - immediately and in their own words. They enable you to learn much more about your target audience than you would through other avenues and you can use surveys to add detail to issues that you’ve identified with other website analytics tools.
Ultimately, surveys enable you to collect data in a precise and structured way, and the responses can confirm or provoke internal discussions around strategic business decisions. They can help you identify and remove pain points, improve the user journey, and help your business to grow in the right direction.
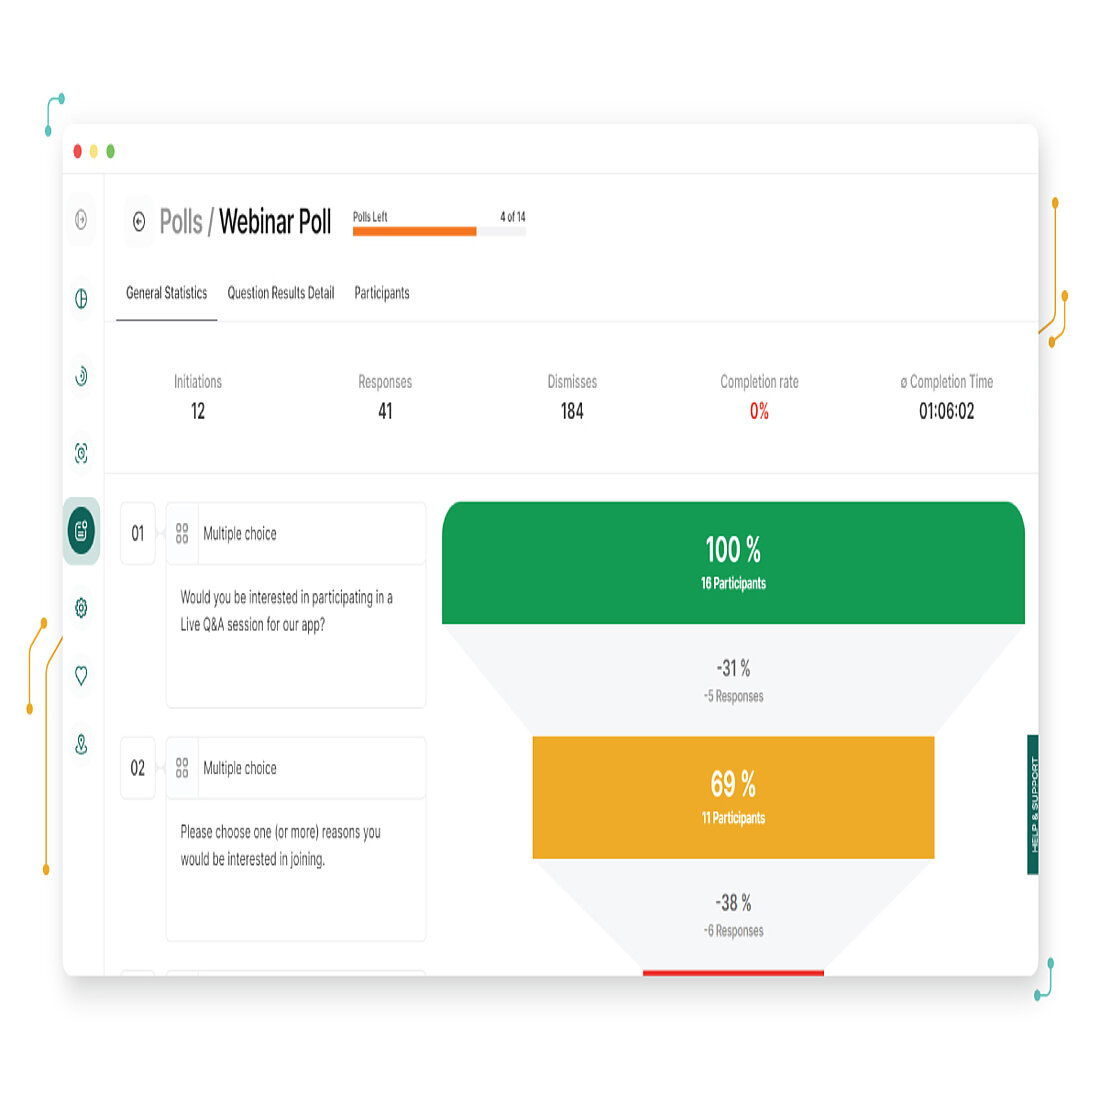
Online Polls
Online polls are mini questionnaires that you integrate into your web pages so as to get direct feedback from internet users as they are interacting with your website.
You can allow anyone to participate, or alternatively limit the responses to whichever segment of your customer base that you want to analyze.
Unlike surveys, polls are normally a single, multiple choice question that users can answer with minimal effort - making engagement much more likely. They can be set up in seconds and enable businesses to interact with their audience, while receiving feedback in real-time.
Polls are an effective visitor communication tool because they provide information about customers’ wants and needs at specific, controllable points along their journey to conversion. And, when combined with other website analytics tools, they can be used to explain the reasons behind user actions, and to find the best way to optimize site usability and the customer journey to purchase.
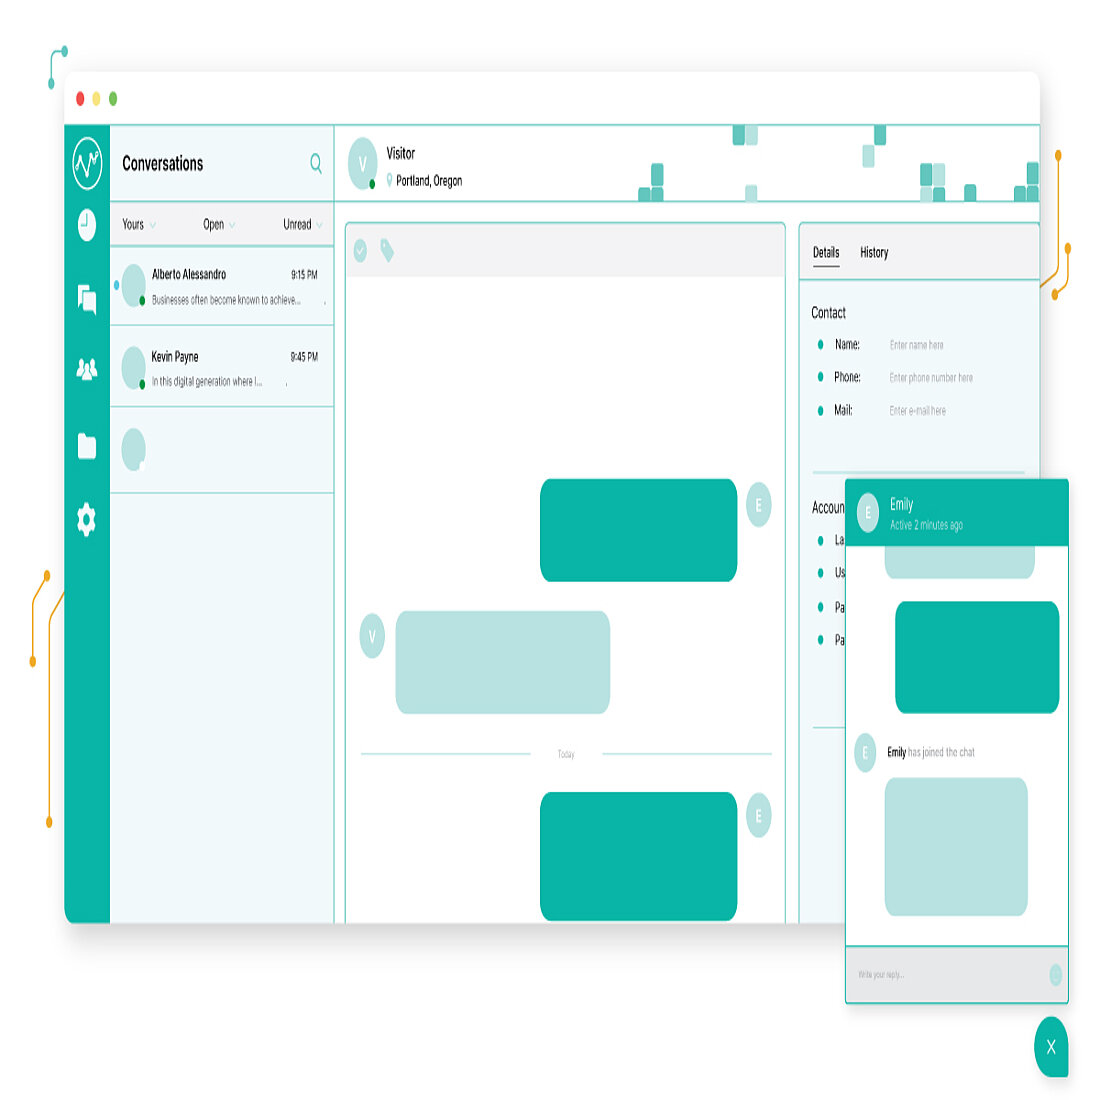
Live Chat
Live chat is a website analytics tool that enables your business to communicate directly with visitors as they move around your webpages.
These pop-up windows are accessible from anywhere on your website and, as the preferred support channel for online customers, they are a reliable way to improve the customer experience and increase conversion rates.
Live chat enables companies to engage directly with their customers and provides them with the help they need in real-time. They can also turn your website into a lead generation powerhouse and are another great avenue for visitor feedback - providing a much better understanding of their preferences than visitor behavior tools alone.
Crucially, live chat also automates many of the more tedious and time-consuming aspects of visitor communications. These chatbots can be set up to carry out repetitive tasks, like emailing prospects and answering frequently asked questions, freeing up your customer support team to focus on work that would most benefit from human involvement.

Common Issues with Website Analytics
Your website data holds a veritable treasure trove of potential business insights, as long as you know when, where, and how to look.
But while what website analytics is able to do with this data may appear objective, there are still various things that can stop you getting the most out of results, and which you need to keep in mind.
Firstly, website traffic is not the most reliable source for data. It’s collected in bulk from large numbers of internet users who are navigating your website from an almost limitless range of technical environments - devices, browsers, operating systems, and so forth.
What’s more, not everyone’s a computer nerd. Some will have connection difficulties, outdated software, or devices riddled with bugs and malware. Alternatively, multiple users could be visiting your website from the same computer. The list goes on but ultimately, the sheer number of variables at play makes data collection and analysis messy, particularly when compared to the scientific method.
Visitor preferences also impact the dataset. Some use browsers with restrictions around code snippets, or install Do Not Track (DNT) or similar adblocking tools. Others will decline or delete the cookies that many analytics tools rely on to collect data. These choices matter, with a striking 95% of internet users blocking additional cookies with one form of privacy control or other (SERNAC).
Given how much this reduces the size of your dataset, it’s wise to choose a website analytics tool with cookieless tracking, since this will increase your access to website analytics data while still respecting the preferences of your website visitors.
Ultimately, the smaller your dataset, the more that it will be affected by any inaccurate data that does make its way through. These can be caused by anything from errors in your JavaScript to timing issues, which jumble the order that user activity is recorded and turn everything into an incoherent mess.
Basic human error can also rear its ugly head, with the website analytics platform installed or calibrated badly. Maybe the tracking code hasn’t been added to every one of your webpages or you've made a mistake writing one of your regular expressions. Data filtering could have been mistakenly turned on. Maybe a technical issue means that the referral bot spam is not being separated out, and which can seriously undermine the reliability of your reports.
This can all further impact the accuracy of your data, but the importance of what website analytics is to digital business shows that imperfect data is far from useless.
Much like using an offset wristwatch to make appointments on time, useful insights can be pulled from inaccurate data, as long as it’s consistently imperfect in the same way.
Most of these data collection issues can be avoided with enough expertise, attention to detail, and with the right quality assurance procedures in place.
However, you still need to interpret this data correctly, and it’s important to remember that these tools only show what internet users are doing - what website analytics is unable to do is show their intent, which is left open to interpretation.
Ultimately, website visitor behavior - like human behavior more broadly - is a difficult thing to measure precisely. So much so that different analytics platforms will return different results from the same data.
Admittedly, each website analytics tool installed will slow down the website slightly and can worsen the user experience. It also adds to the headache that is data siloing, which can stop you from maximizing the potential of your dataset unless you can work out how to sync the different streams together effectively.
Data privacy is also an issue, given that GDPR and other strict data privacy laws make companies responsible for how third-party analytics platforms collect, process, and store the personal data of their website visitors.
There are a few options that do take privacy seriously, like our own TWIPLA platform, and it’s concerning that even Google - the dominant player in the analytics market - pays little interest to data protection requirements and appears happy to put their clients at risk of data enforcement measures.

There is also the paradoxical argument that the simplicity of these tools means that they’re not used properly.
Setup is quick and easy - install a single line of code, they say, and it’s good to go - and many users don’t go any further than this. And, while you may find that your platform works perfectly straight out of the box, it's equally likely that you’ll have to customize the data points before it becomes an effective tool for the specificities of your business.
Their deceptive simplicity also persuades many companies not to invest further in website analytics, meaning that the specialist knowledge required to optimize the optimizer just isn’t there. This includes data attribution and modeling skills, as well as the wider ability to continuously respond to all the key metrics provided - many companies become overwhelmed and give up because they haven’t got the right processes and procedures in place to sustain the various tasks involved.

That’s Website Analytics in a Nutshell!
Well done for making it this far! Hopefully this means that you now have a better understanding of what website analytics is and why it provides such a powerful set of features for any business with a website.
These platforms paint a detailed picture of the effectiveness of your online marketing and are the best way to increase the number of website visitors who become customers.
Website analytics should really be the first tool in your martech stack, and will certainly be one that you reach for most often. And, if you’re looking to jump on the website analytics gravy train but feel overwhelmed by choice, you can easily narrow down your range of options by focusing on privacy-first platforms that include tools from each of the three analytics categories.
Coincidentally enough, these are just a few of the things that our own TWIPLA platform does so well, and why we get such sparkling reviews!
So, get a brew in front of you, have a good nose through the features we provide, and see for yourself whether we can help your business to grow!
And if you liked this article and think that it’ll be interesting to all our marketing brethren and sistren out there, feel free to share it around - we’d really appreciate it!

FAQs
What are some free website analytics tools?
TWIPLA is a platform that has a comprehensive set of website analytics features and which you can use free of charge. Other popular alternatives include Google Analytics, Matomo, and Hotjar.
What was the first web analytics tool?
Hit Counters were the first website analytics tool. Otherwise known as web counters, these odometer-like graphics displayed the image of a number, which increased every time the page had a new visit. Webtrends was the first web analytics company, and arrived in 1993.
What is the difference between social and web analytics?
Website analytics the process of gathering meaningful insights from website traffic data, and using them to inform and support business decisions. Social analytics is a similar tool, but it gathers its insights from social media platforms.
Why is web analytics important for business growth?
Website analytics enables businesses to identify their target audience, improve conversion rates, and make their website more attractive, intuitive, and persuasive. They’re an invaluable tool for helping companies to grow in the digital age.
How can website analytics save you time and money?
Website analytics provides valuable insights in real time that you can use to budget effectively by allocating resources where they’re most needed.
What are the most important website analytics to monitor?
The performance statistics of key website pages, such as your homepage, registration page, and other landing pages, will have the biggest impact on your bottom line. However, you’ll only get the most out of your platform by looking at your website holistically, through combining important performance statistics, with behavioral analysis, and visitor communication data.
How can APIs improve website analytics?
APIs enable website analytics to gather more data for analysis - increasing the dataset available to marketers, and the accuracy of the insights pulled from this data. You can also combine this data with other key metrics to create a holistic understanding of your website’s performance.
What do website analytics tools lack?
Taken together, website analytics tools still haven’t developed to the point that they are able to automatically and accurately identify the intent of website visitors because they can’t read minds, yet - leaving this part of the data analysis to marketing professionals.
Is it okay for professional companies to use Google Analytics to track their websites’ analytics?
Google is one of the most popular website analytics platforms available, but this option doesn’t meet GDPR requirements, is illegal in the EU, and companies found using it could be liable to fines.
Share article

Stay Updated & Get Inbox Insights
Keep pace with the world of privacy-first analytics with a monthly round-up of news, advices and updates!